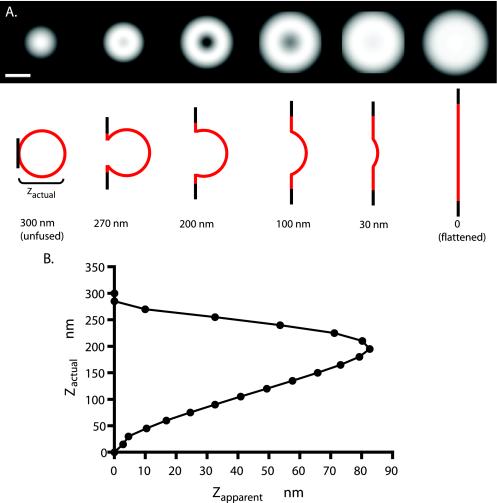
Figure 6.
Computed exocytotic images. The image patterns that might be expected with TIRFM optics for different profiles of a spherical granule fusing with a planar plasma membrane were computed (see Materials and Methods) assuming a 300-nm initial granule diameter, Vamp-GFP-evenly distributed in the granule membrane at all times, and an evanescent field decay constant of 55 nm. The truncated area flattens into a planar annulus with a central hole at the truncation and an outside radius that conserves the total surface area of the granule. The initial projection was convoluted with a point spread function that was derived theoretically and agrees with an experimentally derived estimate from 20-nm-diameter fluorescent beads. (A) The top images are the computed point spread function convoluted images of the exocytotic profiles schematically depicted below. Bar, 300 nm. (B) Relationship between the actual depth of the recessed granule membrane zactual and the apparent depth zapparent, determined by the ratio of the intensities of the dimmest pixel in the center and the brightest in the periphery. Note that for all values of zapparent except the largest, there are two values for zactual. Apparent depth zapparent is greatest when zactual is ∼200 nm.

