Figure 6.
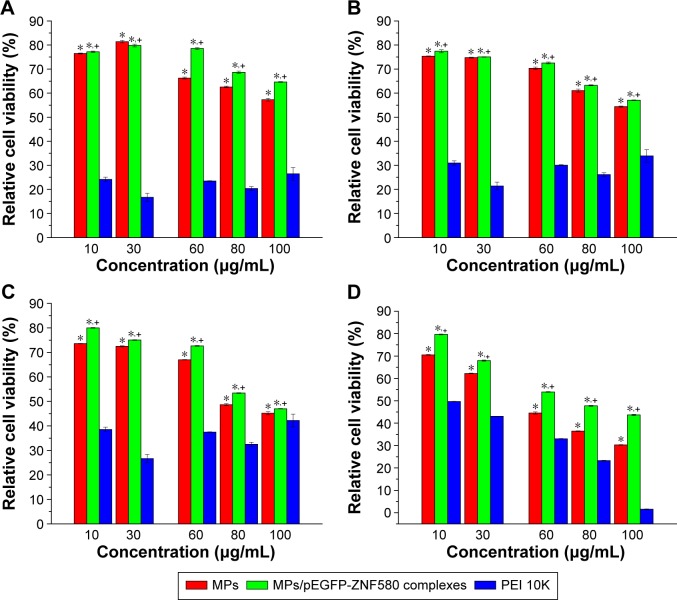
Relative cell viability of EA.hy926 cells with different concentrations of MPs and MPs/pEGFP-ZNF580 complexes at N/P molar ratio of 20.
Notes: Cells treated with PEI (Mw =10 kDa) served as the control group. (A) 3/1 mass ratio of mPEG-b-P(MMD-co-LA) to P(MMD-co-LA)-g-PEI. (B) 2/2 mass ratio of mPEG-b-P(MMD-co-LA) to P(MMD-co-LA)-g-PEI. (C) 1/3 mass ratio of mPEG-b-P(MMD-co-LA) to P(MMD-co-LA)-g-PEI. (D) 0/4 mass ratio of mPEG-b-P(MMD-co-LA) to P(MMD-co-LA)-g-PEI. (±SD, n=3, *P<0.05 as compared with the PEI 10k group; +P<0.05 as compared with the MPs group).
Abbreviations: MPs, microparticles; PEI, polyethylenimine; Mw, weight-average molecular weight; mPEG, methoxy-poly(ethylene glycol); P(MMD-co-LA), poly(3(S)-methyl-morpholine-2,5-dione-co-lactide); SD, standard deviation.

