
Figure 3.
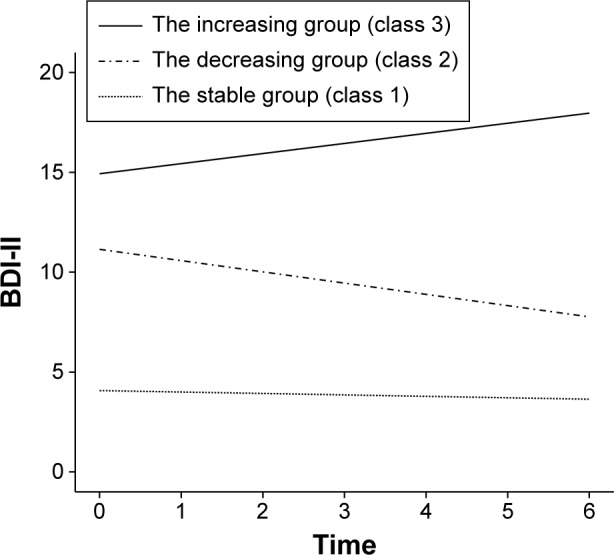
Individual trajectories of depressive symptoms. This represents the results of GMM over the 12 months.
Abbreviations: GMM, growth mixture modeling; BDI-II, Beck Depression Inventory, 2nd edition.
Official websites use .gov
A
.gov website belongs to an official
government organization in the United States.
Secure .gov websites use HTTPS
A lock (
) or https:// means you've safely
connected to the .gov website. Share sensitive
information only on official, secure websites.
Individual trajectories of depressive symptoms. This represents the results of GMM over the 12 months.
Abbreviations: GMM, growth mixture modeling; BDI-II, Beck Depression Inventory, 2nd edition.