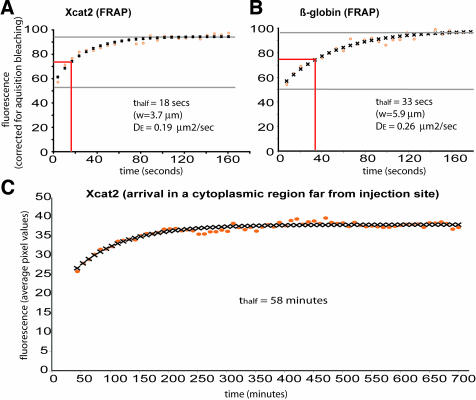
Figure 3.
Diffusion of injected fluorescent RNAs in oocyte cytoplasm. Diffusion of fluorescent Xcat2 3′UTR (A and C) and the β-globin RNA 3′UTR construct (B) injected into stage I oocytes and incubated overnight, as in Figures 1 and 2, was analyzed. FRAP was monitored in A and B, and the arrival of fluorescence in a cytoplasmic region far from the injection site was monitored in C. Theoretical diffusion curves (black crosses) were found to fit closely to the experimental data (orange circles), plotted as mean pixel values in a cytoplasmic region within the bleached zone, normalized relative to an unbleached zone at each time point in the FRAP experiments. Effective diffusion constants (DE) were calculated from the FRAP data (see Materials and Methods).

