Figure 2.
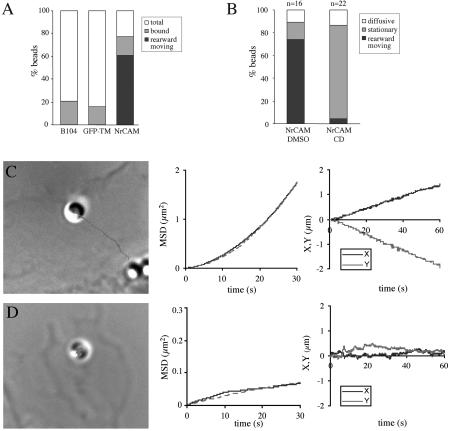
Actin-dependent retrograde mobility of TAG-1 beads on NrCAM-expressing B104 cells analyzed by single particle tracking. (A) Quantitative analysis of TAG-1 beads binding and rearward movement on parental, GFP-TM-, or NrCAM-expressing B104 cells. (B) TAG-1 bead mobility analyzed by time-lapse recording on NrCAM-expressing cells treated for 15 min with DMSO or 2 μM cytochalasin D (CD). (C) Representative trajectory of a TAG-1 bead placed onto NrCAM-expressing B104 cell with optical tweezers. The bead is shown at its original position, at the periphery of the lamellipodium. The trajectory was calculated from the timelapse recording during a 60-s period. The mean squared displacement (MSD) plotted as a function of time interval (plain line) follows a parabolic curve (dashed line) characteristic of a unidirectional diffusion mode as indicated by the directional velocity V = 2.5 μm/min and diffusion coefficient D = 1.3 10-3 μm2 s-1. Plots of X and Y coordinates vs. time show a uniform bead movement away from the leading edge. (D) NrCAM-expressing cell treated with 2 μM cytochalasin D for 15 min before time-lapse recording. The bead showed a stationary behavior. V = 0.3 μm/min and D = 0.3 10-3 μm2 s-1 were calculated from the MSD curve (note that the Y-axis scale of the MSD curve differs from C). X and Y coordinates showed very slight variations vs. time.

