Figure 3.
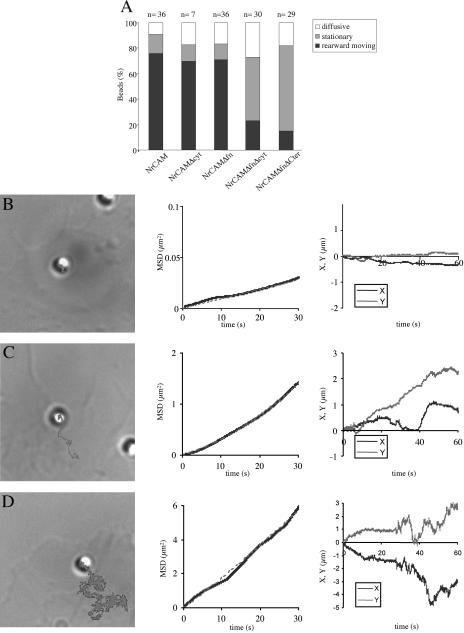
Behavior of TAG-1 beads on B104 cells expressing NrCAM-deleted constructs analyzed by single particle tracking and laser trapping experiments. (A) Quantitative analysis of TAG-1 bead mobility on B104 cells expressing NrCAM, NrCAMΔcyt, NrCAMΔfn, NrCAMΔfnΔcyt, and NrCAMΔfnΔCter. Bead movements were classified as “stationary” when displacement did not exceed 1 μm/min, otherwise as “diffusing” or “rearward moving.” (B–D) Panels exemplifying the three types of TAG-1 bead behaviors on NrCAMΔfnΔcyt-expressing cells: stationary (B), rearward moving (C), and diffusive (D). The beads are shown at the initial attachment site, and the trajectory was deduced from the time-lapse recording during a 60-s period. MSD plotted as a function of time interval (plain line). Plots of X and Y coordinates vs. time. Note that Y-axis scales differ in B, C, and D. (B) Most TAG-1 beads exhibited a stationary behavior. Analysis of a representative trajectory showed a slow directional velocity V = 0.3 μm/min and a diffusion coefficient D = 0.8 10-3 μm2 s-1. (C) A low percentage of TAG-1 beads displayed a directed movement as indicated by the MSD plots vs. time (plain line), which followed a parabolic curve (dashed line). However, the trajectory was irregular as shown in the curves of X and Y coordinates vs. time (compare with Figure 2C for full-length NrCAM). (D) Some of the TAG-1 beads were mostly diffusive, as on this example with chaotic X and Y displacements vs. time. The MSD curve vs. time is in blue, and the red line reflect the best fit of this curve by linear regression and gives an average diffusion coefficient D = 1.3 ± 2.7 10-2 μm2 s-1 (n = 14).

