Figure 8.
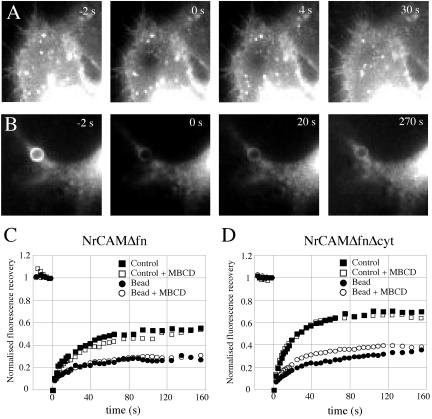
The effect of cholesterol depletion on the mobility of NrCAM analyzed by FRAP. Cells transfected with NrCAMΔfn (C) or NrCAMΔfnΔcyt (A, B, and D) were incubated for 20 min with 4-μm TAG-1 beads and then treated or not with 10 mM MBCD for 15 min. (A and B) Representative images of the FRAP sequence are shown for NrCAMΔfnΔcyt, and are similar to NrCAMΔfn. A 4-μm-diameter spot was photobleached in a region without a bead (A), or precisely on a bead-cell contact where the receptor is heavily clustered (B), and the fluorescence intensity was monitored. (C and D) Kinetics of the fluorescence recovery. Data are normalized to yield an intensity of zero immediately after photo-bleaching and represent the average of 6–12 individual traces. Plain curves are a fit through the data of the function Im*(1 - exp(-t/τ)), where Im is the recovery fraction and τ a recovery time.

