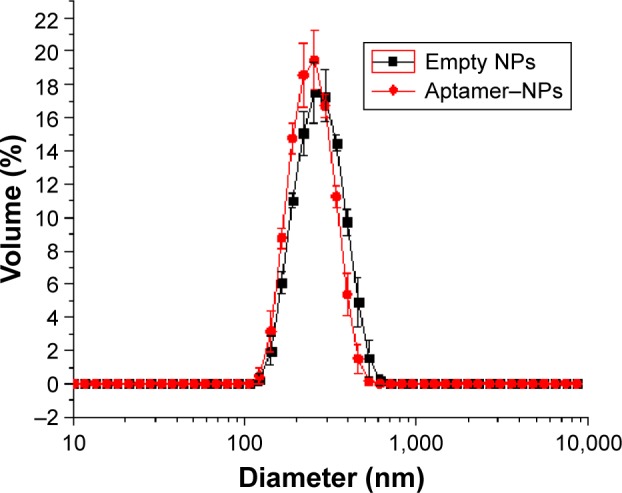
Figure 1.

Mean size and size distribution of the nanoparticles.
Notes: The empty NPs are in black and the aptamer–NPs are in red. Analyses were performed at 25°C after preparation. Error bars indicate standard deviation for the triplicates.
Abbreviation: NPs, nanoparticles.
