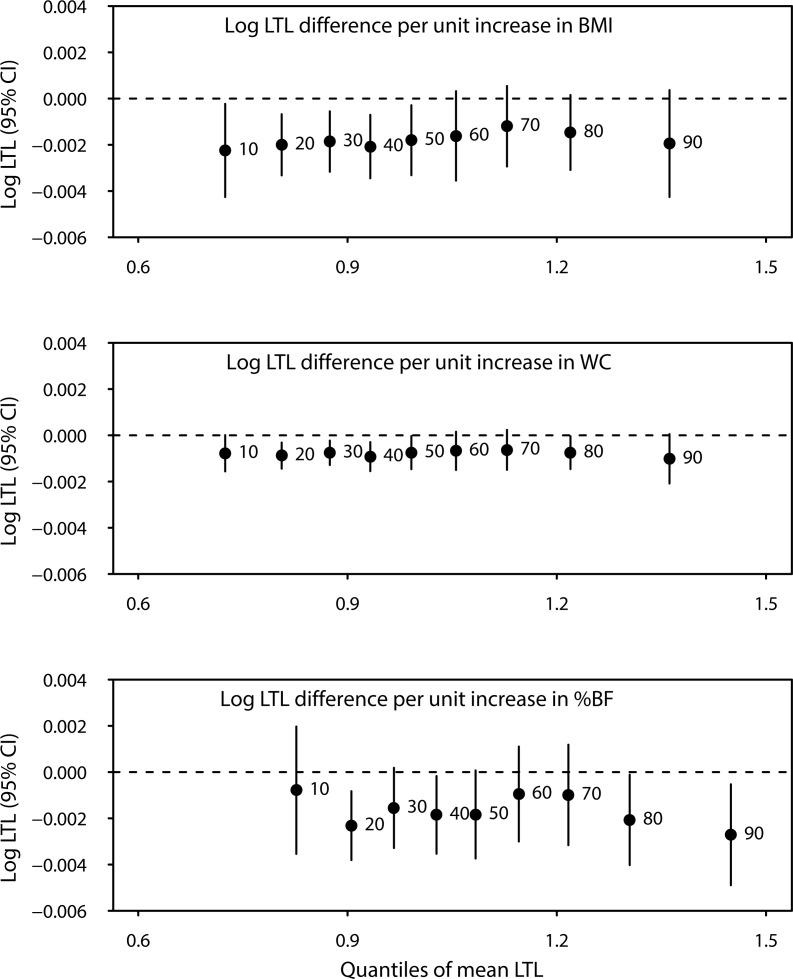
Figure 1. Difference in mean log-transformed LTL (T/S ratio) across quantiles of LTL for every unit increase in body mass index (BMI), waist circumference (WC), and percent body fat (%BF).
All models were adjusted for age at LTL measurement (continuous), sex, race/ethnicity, education, smoking status, alcohol intake, and vigorous physical activity.

