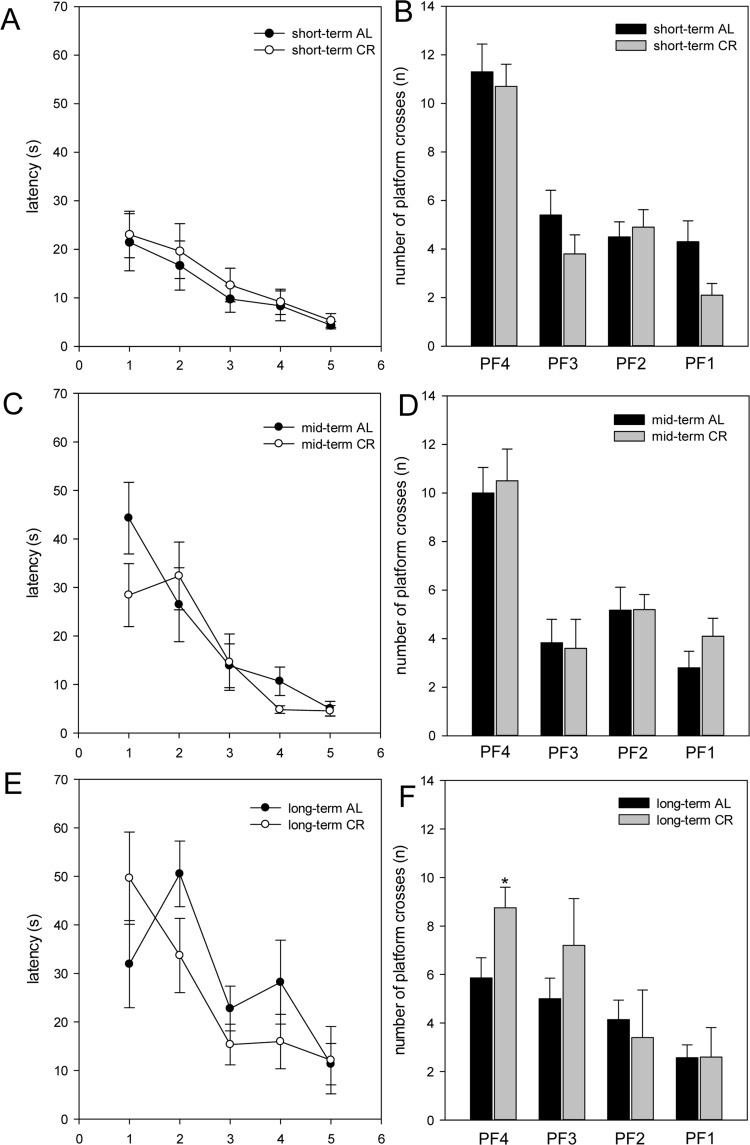
Figure 5.
The escape latencies (in s) of the training were displayed in five blocks (A, C, E; x-axis 1-5). One block consisted of four consecutive trials. The escape latencies decreased throughout the training days. In the test trial, the number of platform crossings during 60 s was measured (B, D, F). ApoE−/− mice were fed either ad libitum (AL) or caloric-restricted (CR, 60% of ad libitum) for a short-term (A and B, 4 weeks; n=14), mid-term (C and D, 20 weeks; n=14) or long-term (E and F, 64 weeks; n=14) and were trained and tested 5 days before being sacrificed. Values are given as mean±SEM; ANOVA, post-hoc pairwise comparison tests: *p < 0.05 vs. AL.

