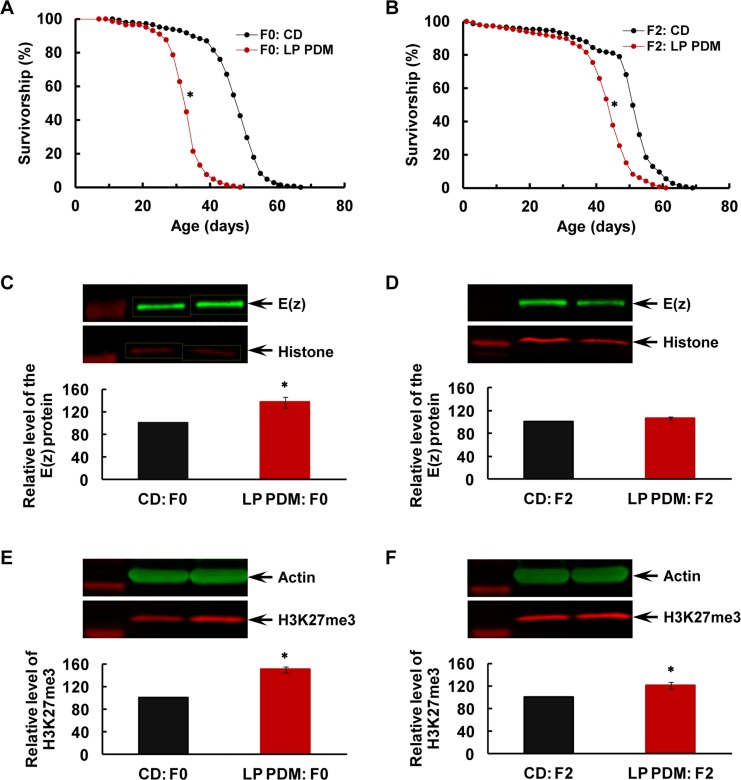
Figure 1. Transgenerational longevity decrease and H3K27me3 upregulation after the LP PDM in the F0 parents.
(A-B) Survival curves for virgin males, (C-D) E(z) protein level (with sample westerns shown above the quantification in the same order of respective lanes; same for all the following figures with western analyses), and (E-F) H3K27me3 level in the F0 parents (A, C and E) and the F2 flies (B, D and F). After 7-day PDM of the F0 parents with the LP diet (in red) or control diet (CD; in black), all the F0 flies and their F1 and F2 offspring were maintained on the CD at all times. N=145-147 for longevity analyses, and N=4 for western analyses of E(z) and H3K27me3. The asterisk (*) indicates a significant difference from control (see main text for specific P values).

