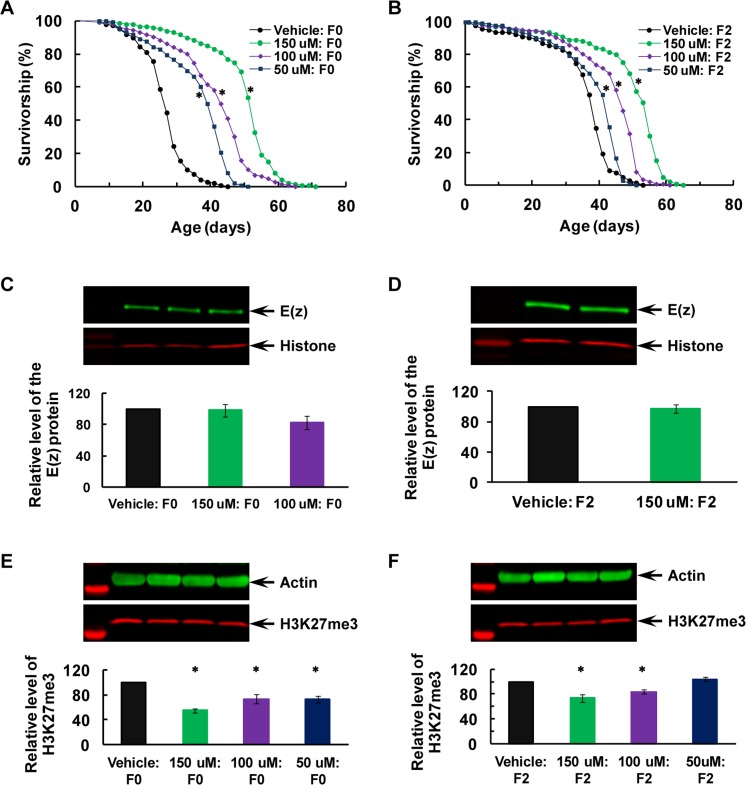
Figure 3. Transgenerational longevity extension and H3K27me3 downregulation after post-eclosion inhibition of the E(z) enzymatic function in the F0 parents.
(A-B) Survival curves for virgin males, (C-D) E(z) protein level, and (E-F) H3K27me3 level in the F0 parents (A, C and E) and their F2 offspring (B, D and F). All the flies were raised on CD at all times after EPZ-6438 feeding dissolved in 5% sucrose as vehicle. Inhibition of the E(z) methyltransferase activity was induced for 7 days following eclosion in a dose-dependent manner. The doses of 100, 200 and 400 μM were first used to determine an effective dose at 100 μM through western analyses of H3K27me3 (see Figure S3 for details). Then 50 μM (in blue), 100 μM (in purple) or 150 μM (in green) EPZ-6438, or vehicle (in black) were used for subsequence longevity and western analyses. N=145-147 for longevity analyses, and N=4 for western analyses of E(z) and H3K27me3. The asterisk (*) indicates a significant difference from control (see Table S2 for detailed analyses and specific P values).

