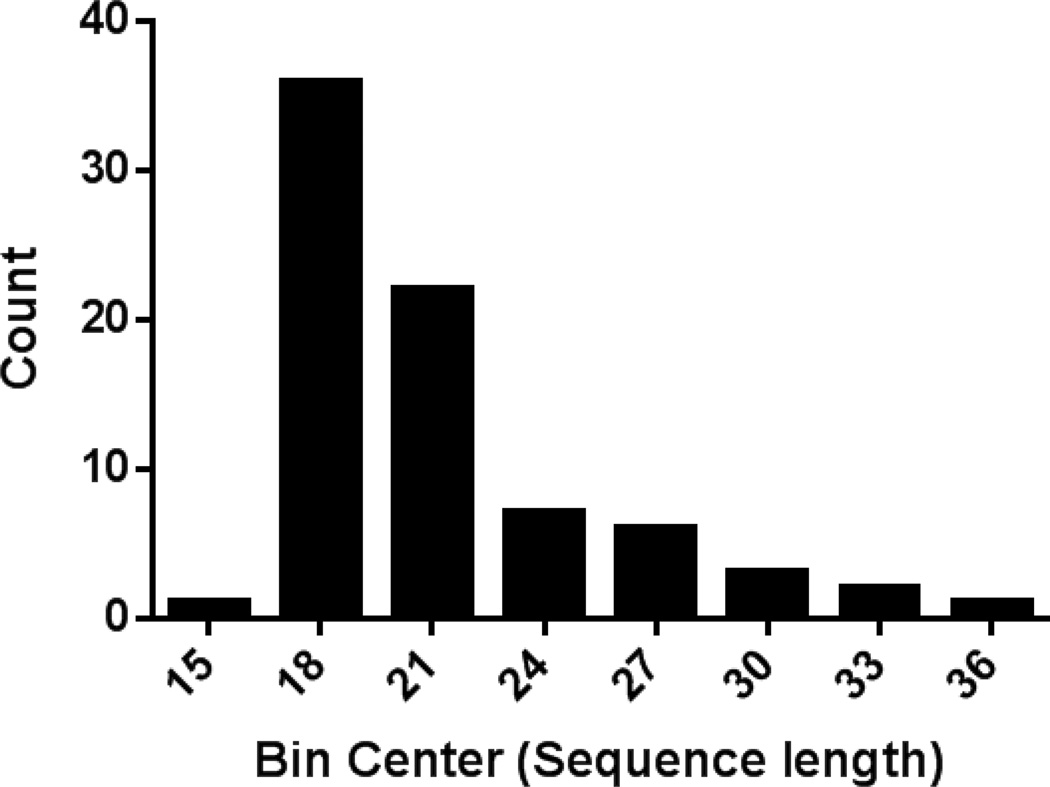
Figure 1. Histogram showing the distribution of HCD sequence lengths.
The lengths of identified HCD sequences (core + boundary residues) were determined and analyzed according to size distribution. Bin centers are presented on the x-axis and bin width was set to 3. The number of sequences whose length fell within a specified bin is indicated on the y-axis.

