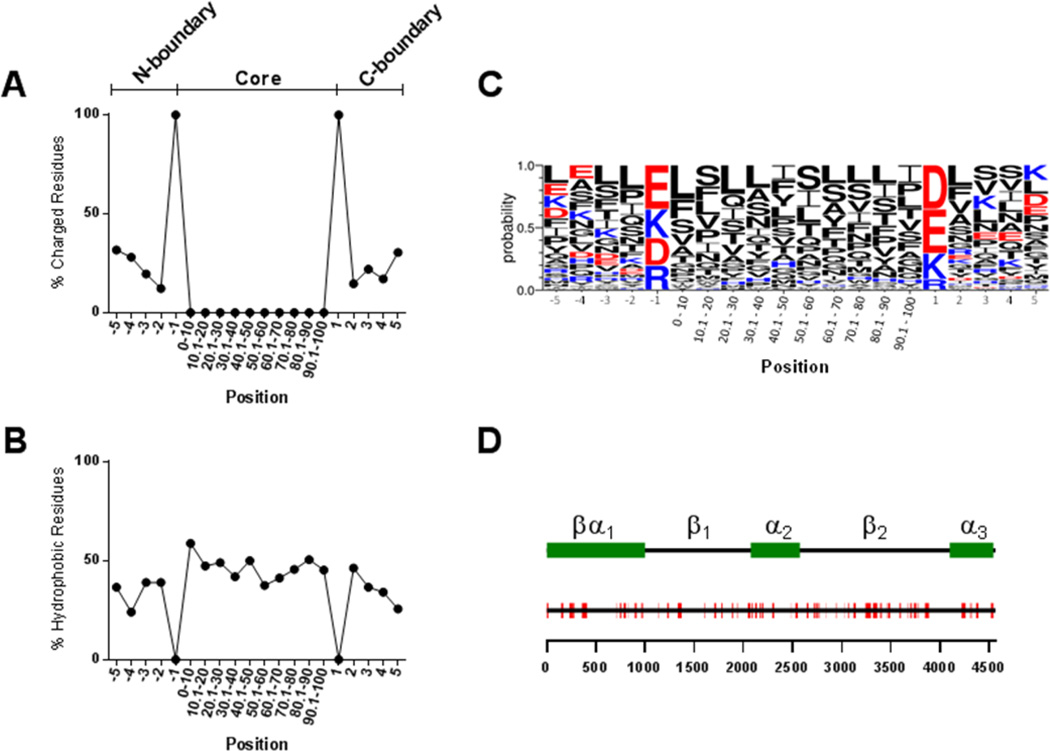
Figure 2. Properties of identified HCD sequences.
The distribution of charged (A) and hydrophobic (B) residues along the 78 HCD sequences was analyzed. Positions -1 and 1 represent the upstream and downstream charged boundary residues, respectively. The core region, due to varying lengths among HCD sequences, is represented as equal sized domains each composed of 10% of the sequence length. LOGO analysis was performed to determine the probability of the appearance of specific amino acid residues at each position (C). The positions of the 78 HCD sequences (red) are shown along the full length apoB sequence (black line) (D). The scale below indicates amino acid position within apoB and the legend above indicates the positions of the domains from the pentapartite model of apoB structure (55).

