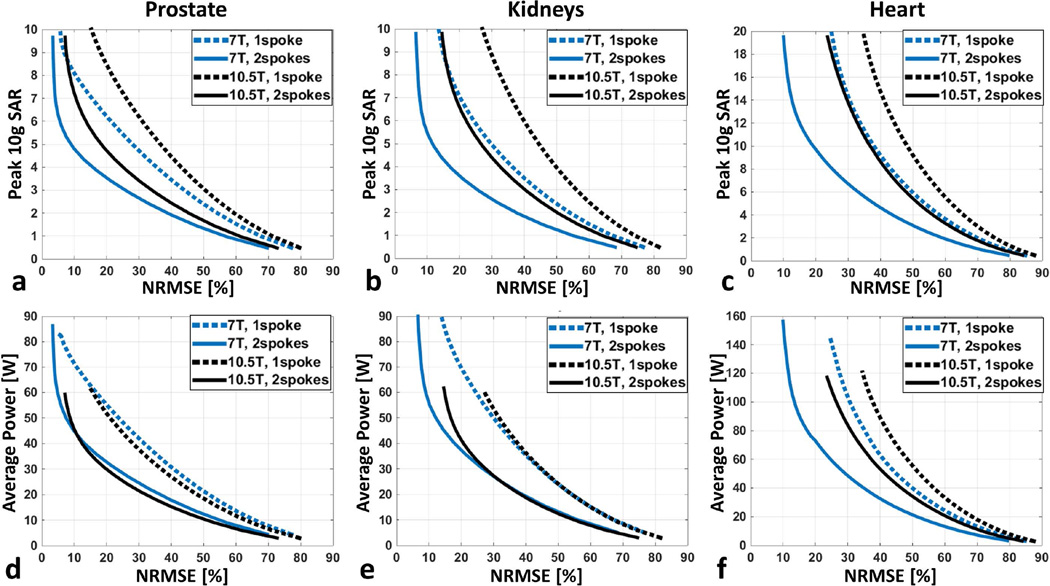
Figure 5.
L-curves demonstrating the tradeoff between excitation error (NRMSE) and resulting peak local SAR for 7.0 T (blue) and 10.5 T (black) arrays when designing 1-spoke (dashed) and 2-spoke (solid) pTx pulses to image (a) the prostate, (b) the kidneys and (c) the heart. The pTx pulses were designed with explicit local SAR constraint, and the L-curve per design scenario was created by varying the predefined peak 10 g SAR limit. In all cases, the nominal flip angle was 45 degrees. Note that combining 2-spoke pulse design with our 10.5T dipole array provided comparable (when imaging kidneys or heart) or even better (when imaging prostate) RF performance than single-spoke designs at 7.0T. L-curves demonstrating the tradeoff between excitation error (NRMSE) and required average total array power for 7.0 T (blue) and 10.5 T (black) arrays for 1- and 2-spoke (solid) pTx pulses to image (d) the prostate, (e) the kidneys and (f) the heart are shown.

