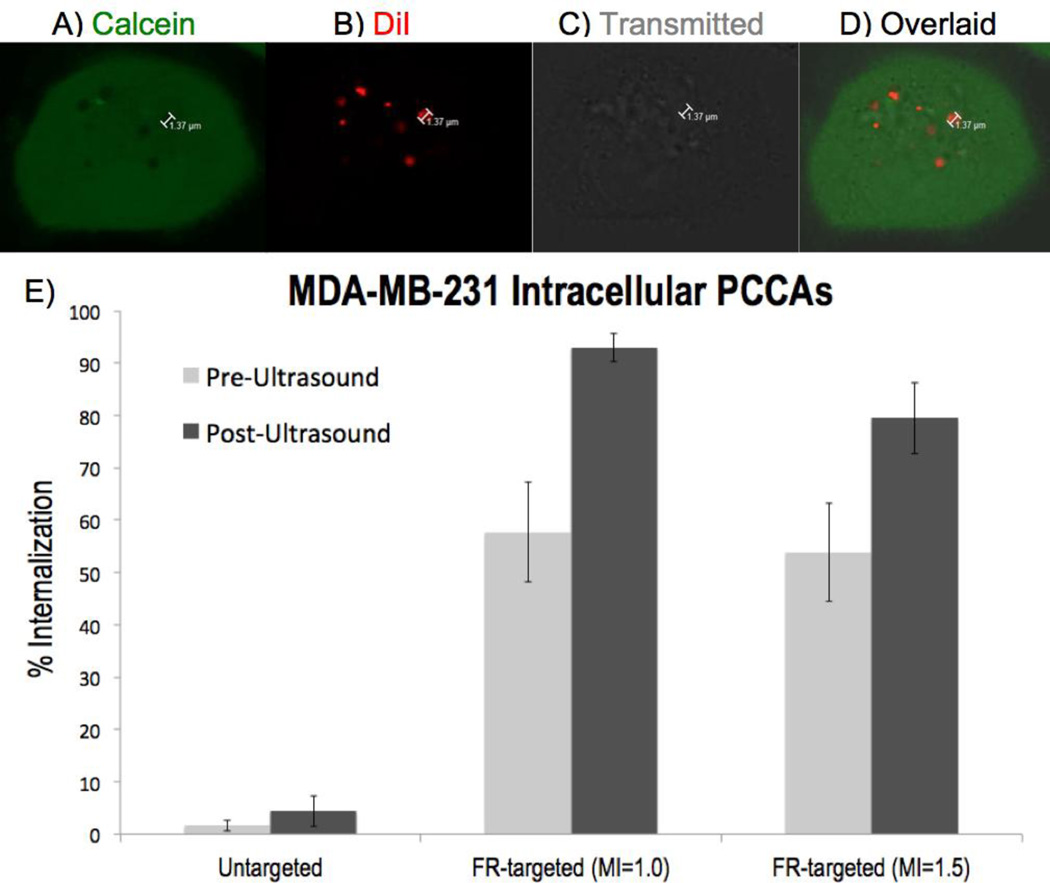
Figure 3.
MDA-MB-231 intracellular imaging, with top row (A–D) depicting 7 FR-targeted PCCAs activated intracellularly after insonation at MI = 1.0 (A) Calcein stains the cytoplasm of living cells. (B) DiI stains the lipid shell of PCCAs. (C) Transmitted light channel shows bubble-like structures intracellularly. (D) All three channels overlaid shows the colocalization of DiI+ / calcein- regions. (E) Graph depicts the proportion of MDA-MB-231 cells (mean +/− SE) with at least 1 intracellularly activated microbubble before (left, light gray) and after (right, dark gray) ultrasound application.

