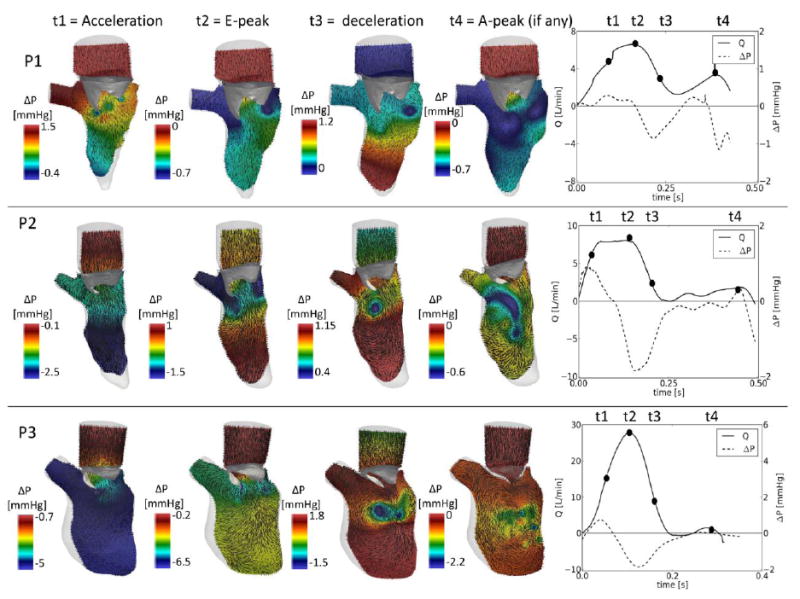
Figure 3.

Intraventricular flow on a 2D slice and pressure variations (section S1 indicated in fig.1) at four relevant time-points. Right panels: volume flow rate curve (solid line), calculated at the atrial inlet, intraventricular pressure gradient, calculated as the difference of the average pressure between the cross section 1 and 2 (CS1 and CS2) of figure 1. Note that the scale of the pressure changes in each panel.
