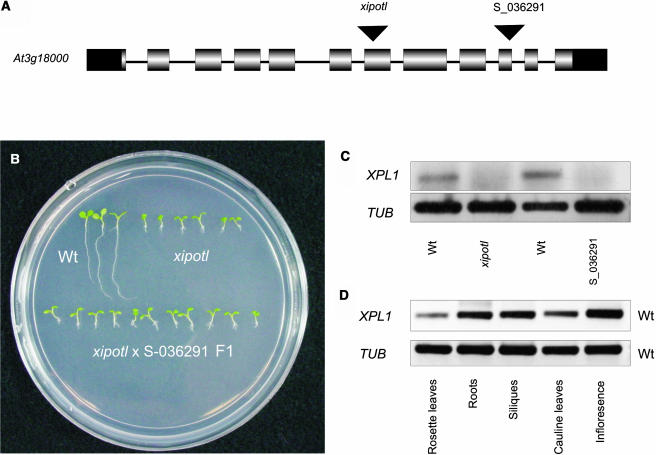
Figure 2.
Genetic and Molecular Analysis of xipotl and S_036291 Seedlings and XPL1 Expression.
(A) Schematic representation of XPL1 genomic organization, indicating the insertion at exon 7 in xipotl and at exon 10 in S_036291.
(B) Plants (8 dag) of the F1 population from the cross between homozygous xipotl and homozygous S_036291 mutant plants.
(C) Detection of XPL1 transcripts by RT-PCR in wild-type Columbia 0 (Col 0), xipotl, and S_036291 plants (lane 1) and the tubulin expression control (lane 2).
(D) Tissue-specific RT-PCR analysis of XPL1 expression in wild-type Col 0 plants (lane 1) and the tubulin expression control (lane 2).

