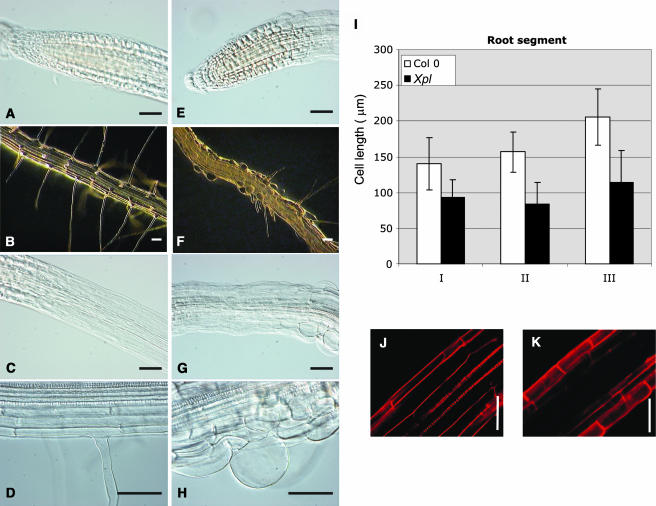
Figure 4.
Comparison of Cellular Anomalies between Wild-Type and Mutant Plants.
Microscopic analysis of wild-type ([A] to [D]) and mutant plants ([E] to [H]). Nomarski optics images of the meristem ([A] and [E]), elongation zone ([C] and [G]), and root hair cells ([D] and [H]). Cell length quantification of three different root sections (I): apical elongation zone (I), middle zone (II), and basal zone (III) of wild-type and mutant primary roots. Stereoscopic images of 8-dag plants of a root section at the differentiation zone ([B] and [F]). Confocal images of PI-stained root sections showing cell length differences between wild-type (J) and mutant (K) plants. Bars in (A) to (H), (J), and (K) = 50 μm.

