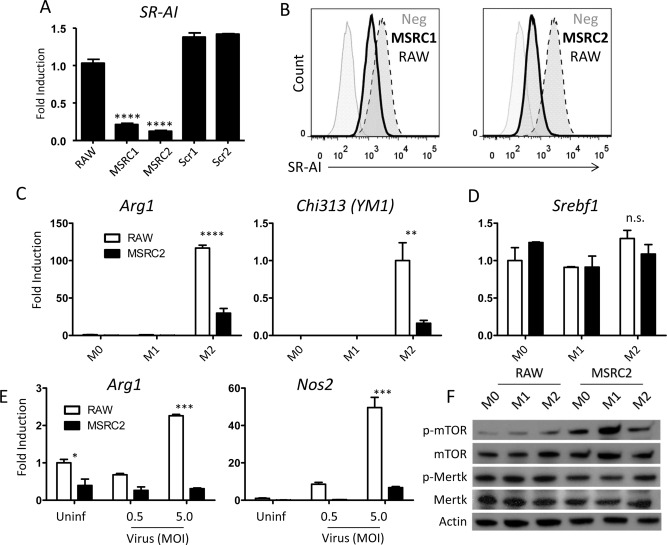
Figure 4.

Generation of a stable MSR knockdown cell line. (A) qPCR analysis of relative Msr1 expression in two subcultures of small interfering RNA (siRNA)‐transfected cells and two subcultures transfected with scrambled control plasmids. Expression levels were calculated by the delta‐delta threshold cycle method and normalized to hypoxanthine guanine phosphoribosyl transferase expression, then normalized to expression of untransfected RAW cells. Data are mean ± SEM for n = 3; **** P < 0.00005. (B) Flow analysis of SR‐AI expression after transfection with lentivirally packaged anti‐Msr1 siRNA. The bold trace represents transfected RAW cell subclones whereas the dotted trace represents WT RAW cells. (C,D) qPCR analysis comparing arg1, chi313, and srebf1 expression by stable knockdown MSRC2 cells to that of untransfected RAW cells. Expression levels were calculated as in (A). Data are mean ± SEM for n = 3; ** P < 0.005; **** P < 0.00005. (E) Arg1 and Nos2 gene expression of MSRC2 and untransfected RAW cells following overnight coculture with 0, 0.5 MOI, or 5.0 MOI of AdOVA in complete media. Expression levels were calculated as in (A); data are mean ± SEM for n = 3. (F) Western blotting of phosphorylated and total mTOR and Mertk from whole cell lysates of RAW or MSRC2 cells incubated for 2 hours in either plain media (M0), LPS (M1), or IL‐4 and IL‐13 (M2). Images are representative of three independent experiments. Abbreviation: p, phosphorylated.
