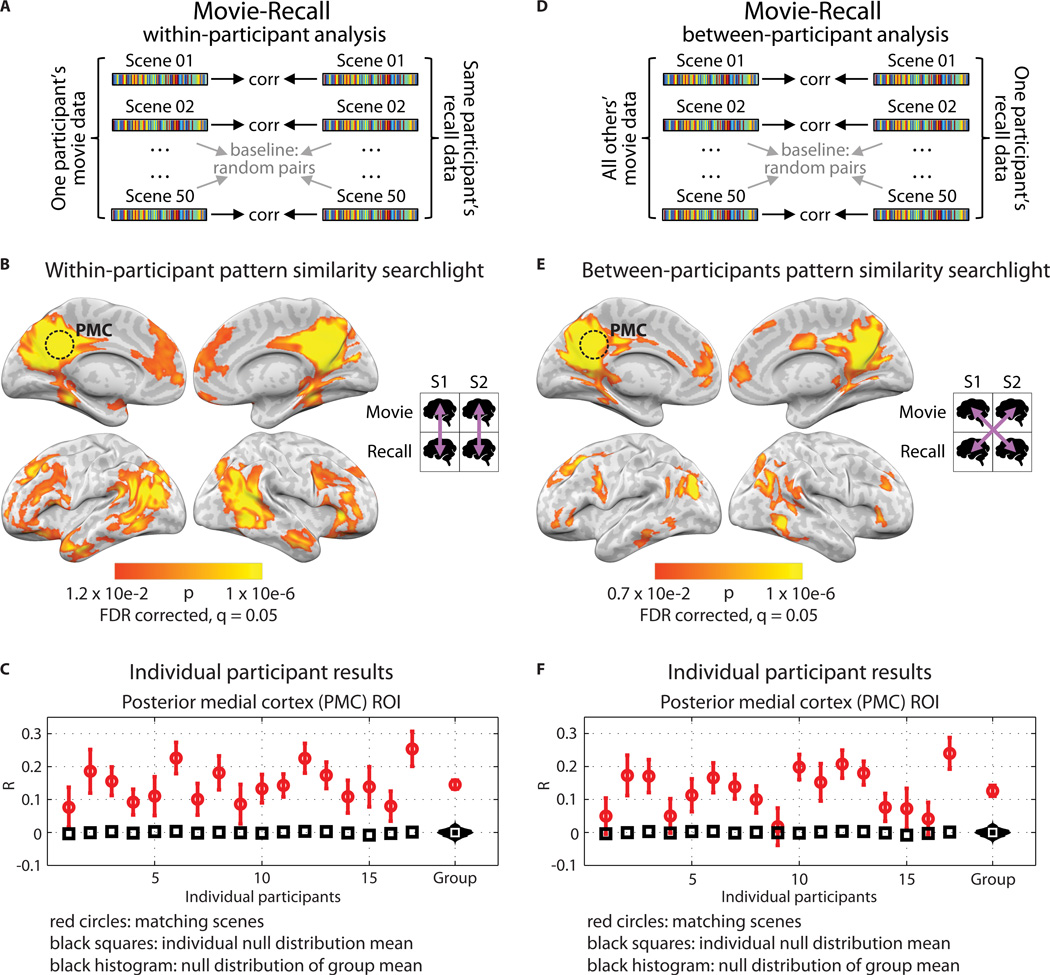
Figure 2. Pattern similarity between movie and recall.
A) Schematic for within-participant movie-recall (reinstatement) analysis. BOLD data from the movie and from the recall sessions were divided into scenes, then averaged across time within-scene, resulting in one vector of voxel values for each movie scene and one for each recalled scene. Correlations were computed between matching pairs of movie/recalled scenes within participant. Statistical significance was determined by shuffling scene labels to generate a null distribution of the participant average. B) Searchlight map showing where significant reinstatement was observed; FDR correction q = 0.05, p = 0.012. Searchlight was a 5×5×5 voxel cube. C) Reinstatement values for all 17 participants in independently-defined PMC. Red circles show average correlation of matching scenes and error bars show standard error across scenes; black squares show average of the null distribution for that participant. At far right, the red circle shows the true participant average and error bars show standard error across participants; black histogram shows the null distribution of the participant average; white square shows mean of the null distribution. D) Schematic for between-participants movie-recall analysis. Same as [A], except that correlations were computed between every matching pair of movie/recall scenes between participants. E) Searchlight map showing regions where significant between-participants movie-recall similarity was observed; FDR correction q = 0.05, p = 0.007. F) Reinstatement values in PMC for each participant in the between-participants analysis, same notation as [C].

