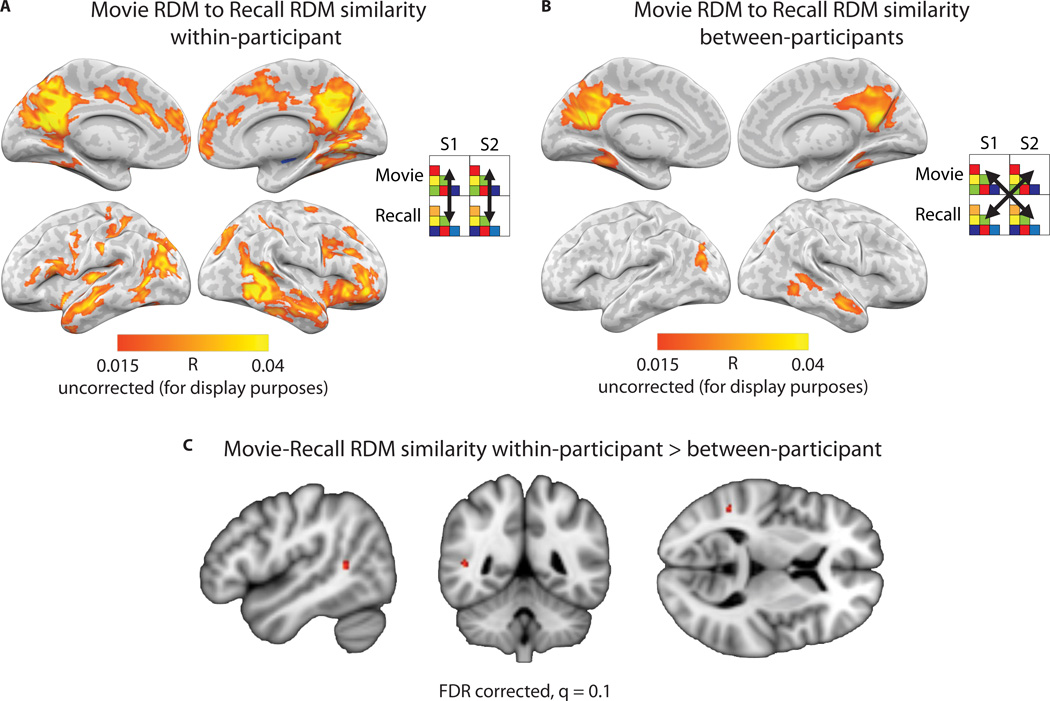
Figure 8. Reinstatement in individual participants vs. between participants.
A) Searchlight analysis showing similarity of representational dissimilarity matrices (RDMs) within-participant across the brain. Each RDM was composed of the pairwise correlations of patterns for individual scenes in the movie (“movie-RDM”) and separately during recall (“recall-RDM”). Each participant’s movie-RDM was then compared to his or her own recall-RDM (i.e., within-participant) using Pearson correlation. The average searchlight map across 17 participants is displayed. B) Searchlight analysis showing movie-RDM vs. recall-RDM correlations between participants. The average searchlight map across 272 pairwise combinations of participants is displayed. C) The difference was computed between the within-participant and between-participant maps. Statistical significance of the difference was evaluated using a permutation analysis and FDR corrected at a threshold of q=0.05. A cluster of two voxels located in the temporo-parietal junction survived correction (map shown at q=0.10 for visualization purposes, 5-voxel cluster).

