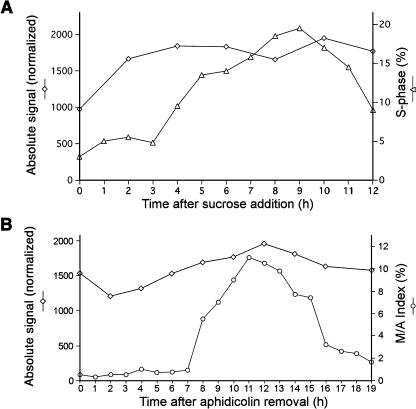
Figure 6.
Level of AtMAP65-1 Transcript through the Cell Cycle.
The level of AtMAP65-1 transcript was quantified with Affymetrix microarrays as described by Menges et al. (2003).
(A) The Arabidopsis suspension culture cells were synchronized by sucrose starvation, and mRNA samples were collected and measured after sucrose addition to the medium. Diamonds, level of AtMAP65-1 transcript; triangles, percentage of cells in S-phase.
(B) The cells were synchronized with the DNA synthesis inhibitor aphidicolin, and samples for mRNA quantification were collected after the herbicide was washed off. Diamonds, level of AtMAP65-1 transcript; open circles, percentage of cells in metaphase/anaphase (M/A).

