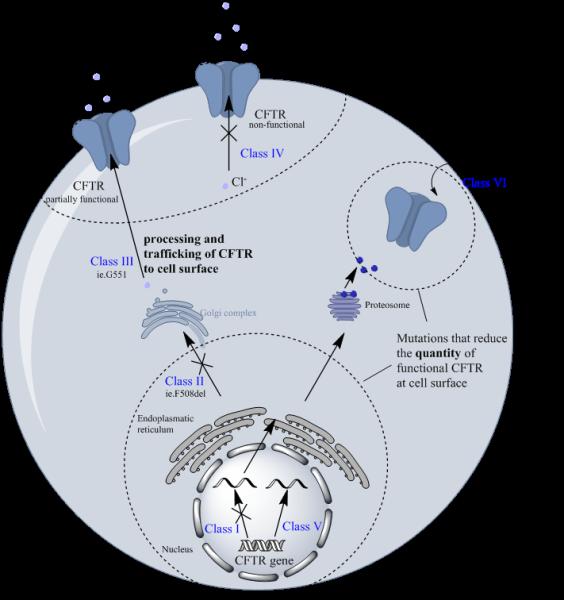
Figure 1B.

Schematic diagram showing the outcomes of CFTR mutation classes I, II, III, IV, V, and VI. Mutation that reduce the trafficking of functional CFTR to the cell surface are classed as III and IV. Mutations that reduce the total quantity of cellular CFTR are classed as I, II, V, VI.
