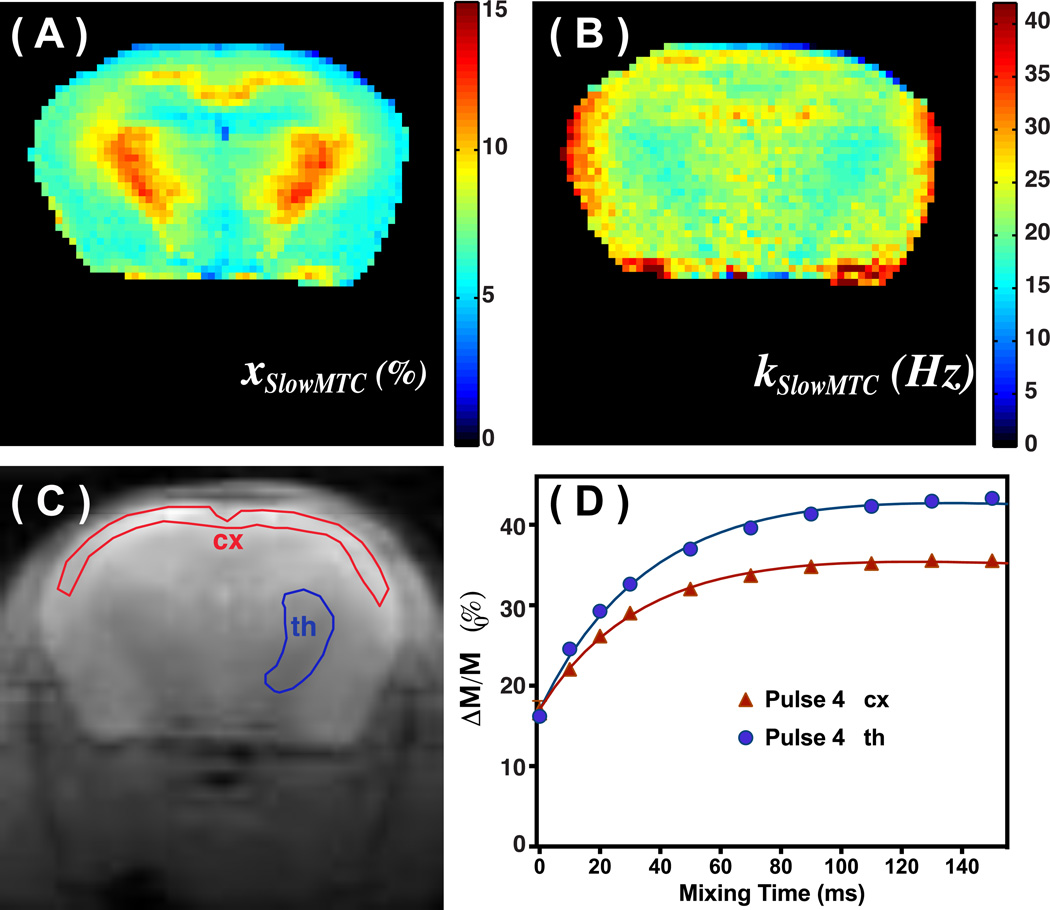
Figure 4.
xslowMTC (A) and exchange rate kslowMTC maps (B) of mouse brain calculated from the VDMP buildup curves resulting from four binomial pulses (2ms, 93.6 µT) and fitted using a two-pool model. (C) The M0 images recorded on the same slice of the mouse brain. The ROIs for obtaining the VDMP buildup curves are labeled. (D) The corresponding VDMP buildup curves of the cortex (cx) and thalamus (th) together with fitted curves.

