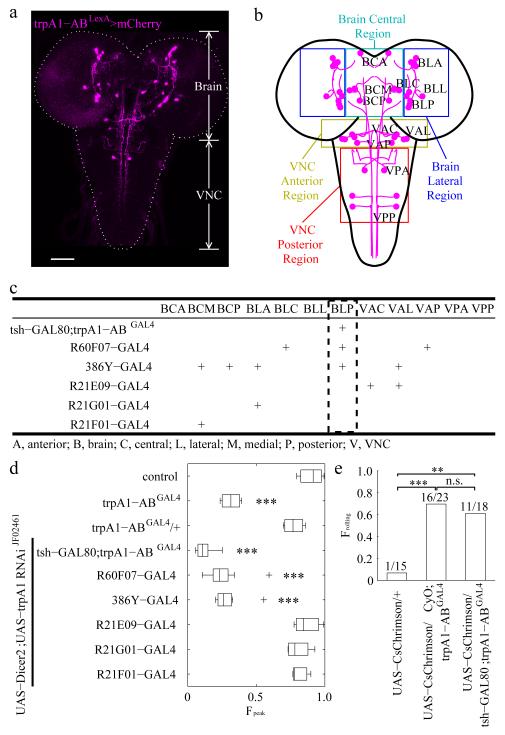
Figure 4.
Identifying trpA1-AB neurons in the larval brain required for heat-induced rolling. (a) Expression of the trpA1-AB reporter in the CNS of 3rd instar larvae. The fly line used for the immunostaining with anti-DsRed was trpA1-ABLexA,LexAop-frt-mCherry-STOP-frt-ReaChR::Citrine/+. The trpA1-AB isoforms were expressed in the brain and ventral nerve cord (VNC). The dashed line outlines the brain and VNC. The scale bar represents 50 μm. (n=7). (b) Map of trpA1-AB neuronal clusters in the brain and VNC. The colored boxes show the regions that define the first two letters of the three letter nomenclature. The first letter indicates whether the neurons were in the brain (B) or the VNC (V). The second letter indicates the general region within the brain or VNC that contained the neuronal cell bodies: A, anterior; C, central; L, lateral; P, posterior. The third letter indicates the relative positions of the neuronal clusters within the general regions of the brain and VNC: A, anterior; C, central; L, lateral; M, medial, P, posterior. For example, “BLP” indicates the posterior neuronal cluster in the lateral region of the brain. (c) Summary of the expression patterns of the indicated GAL4 reporters in trpA1-AB positive neurons of 3rd instar larvae. “+” denotes expression in the indicated neurons. The expression patterns are shown in Supplementary Fig. 6 and Supplementary Fig. 7. (d) Effect on rolling behavior (FPeak) of 2rd instar larvae resulting from knockdown of trpA1, using the UAS-Dicer2;UAS-trpA1 RNAi line and the indicated GAL4 drivers. The temperature increased from 23.5°C to 40°C with a dT/dt=0.1°C/s. The center lines of the boxes represents the median value. The left and right edges of the boxes represent the 25th percentiles (q25%) and 75th percentiles (q75%) of the sample data, respectively. The “+” indicate points as outliers if they are greater than q75% + 1.5 (q75% – q25%) or less than q25% − 1.5 (q75% – q25%). The whiskers indicate the minimum and maximum value of data points except for outliers. We performed one-way ANOVA on the Fpeak values to test for significant different distributions between genotypes [n = 3, 4, 4, 8, 9, 8, 3, 4, 3. The n represents the number of independent experiments. F(8,37)=45.38; p=8.1 × 10⁻¹⁷]. We used the Tukey-Kramer test to ascertain statistically significant differences between the control (w1118) and other samples. Significant differences relative to the control are indicated (*** p < 0.001): 1) trpA1-ABGAL4, q(37,9)=10.45, p=3.9 × 10⁻⁷, 2) UAS-Dicer2;UAS-trpA1-RNAiJF02461 × tsh-GAL80;trpA1-ABGAL4: q(37,9)=15.68, p=9.0 × 10⁻⁸, 3) UAS-Dicer2;UAS-trpA1-RNAiJF02461 × R60F07-GAL4: q(37,9)=13.12, p=9.1 × 10⁻⁸, and 4) UAS-Dicer2;UAS-trpA1-RNAiJF02461 × 386Y-GAL4: q(37,9)=12.19, p=9.7 × 10⁻⁸. (e) Triggering rolling behavior of 2rd instar larvae by optogenetically activating trpA1-AB neurons. We manually recognized the rolling behaviors of each larvae. We stimulated the larvae with light and scored the larvae with either 1.0 or 0 depending on whether or the not the larvae rolled. The bar heights provide the fraction of larvae showed rolling behavior. The numbers above the bars are Nrolling/Ntotal, where Nrolling represents the number of larvae rolling and Ntotal provides the total number of larvae. We performed Fisher’s exact test between each genotype. The comparisons with significant differences are indicated with asterisks (** p < 0.01, *** p < 0.001). n.s., not significant. We obtained the following values for the following comparisons: 1) UAS-CsChrimson/+ versus UAS-CsChrimson/CyO;trpA1-ABGAL4 (odds ratio=32, p=0.00016), 2) UAS-CsChrimson/+ versus UAS-CsChrimson/tsh-GAL80;trpA1-ABGAL4 (odds ratio=22, p=0.0028), 3) UAS-CsChrimson/CyO;trpA1-ABGAL4 versus UAS-CsChrimson/tsh-GAL80;trpA1-ABGAL4 (odds ratio=0.69, p=0.74).

