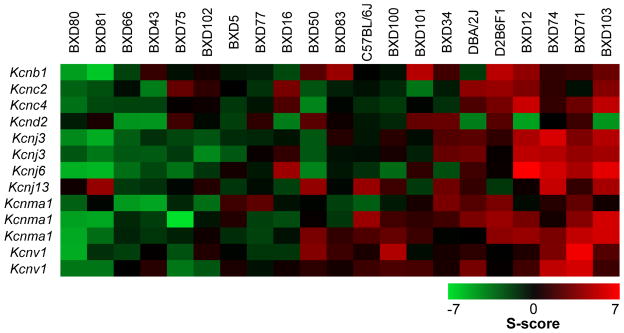
Figure 3. K+ channel gene expression changes in the nucleus accumbens induced by chronic intermittent ethanol exposure of BXD strains of mice.
Strain heat maps of significantly different gene expression responses based on S-score analysis in the nucleus accumbens (n = 21 strains). Positive S-scores (shown in red) indicate up-regulation by CIE exposure and negative S-scores (shown in green) indicate down-regulation by CIE exposure.

