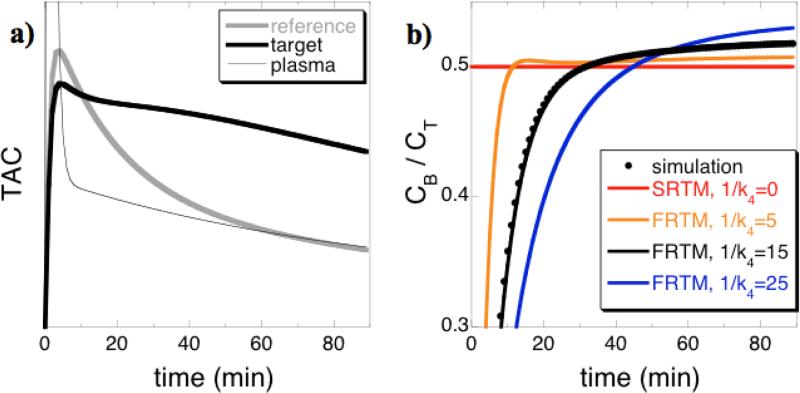
Fig. 2.
a) Simulated time-activities of a reference region (gray) and target region (black) for relatively low-binding regions using (a) BP = 1 and 1/k4 = 15 min. b) The corresponding ratio of bound to total concentration of PET ligand in the target region versus time (black points) is compared to the model estimate for SRTM (red) and FRTM using values of 1/k4 from 5 to 25 minutes.

