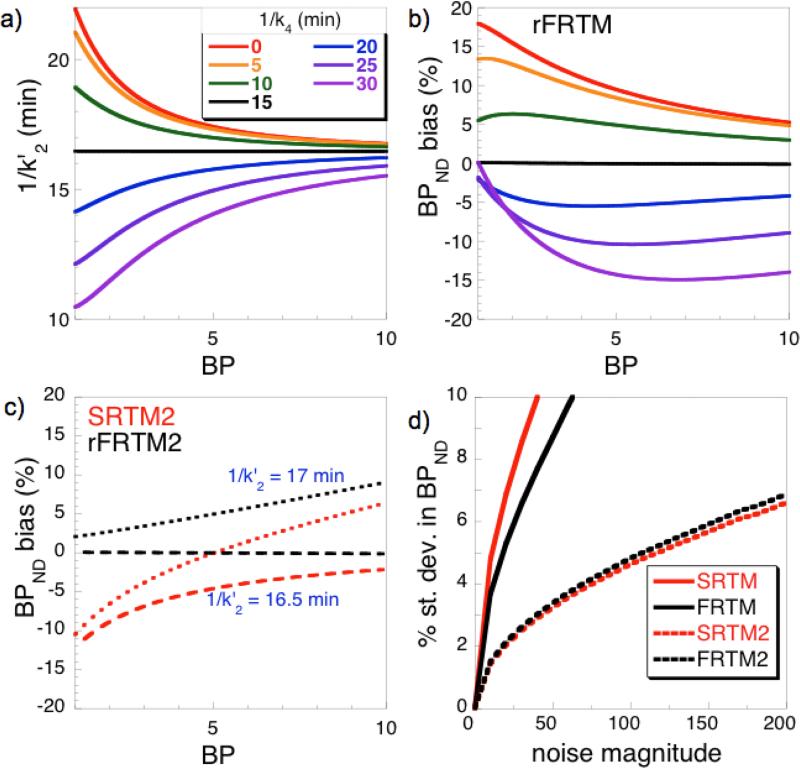
Fig. 3.
Analyses of simulated data. (a) An offset time constant 1/k4 equal to the true value (15 min) removes the variation of the derived reference-region outflow time constant 1/k2′ versus BP using rFRTM. A value of 1/k4 =0 corresponds to SRTM (red). (b) Bias in BPND for the same set of k4 values used in panel (a). (c) Bias in BPND for 2-parameter reductions SRTM2 (red) and rFRTM2 (black) using values for 1/k2′ of 16.5 min (long dashes) or 17 min (short dashes). (d) The percent standard deviation of BPND values at varying levels of noise.

