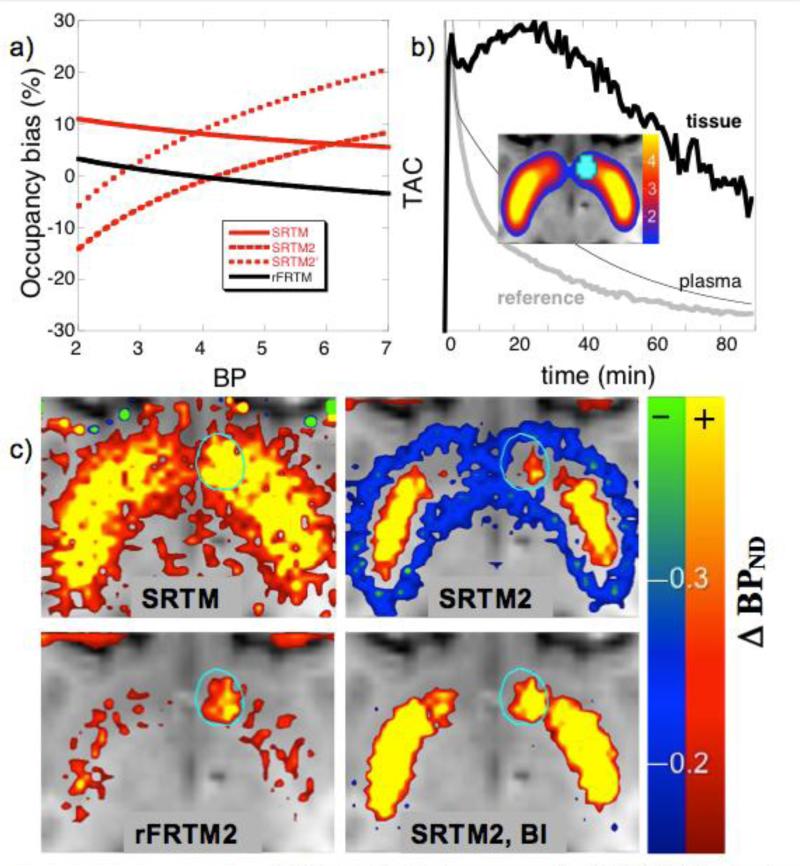
Fig 4.
a) Noiseless simulations of [11C]raclopride bias in occupancy for SRTM, SRTM2 using two different values of k2′ (see text), and rFRTM2 as calibrated using Eq. 3. b) A typical TAC for simulations of a localized 10% increase in occupancy occurring at 40 minutes in the right nucleus accumbens (cyan); the image shows basal BPND values used in simulations. c) Maps of change in BPND using different analysis methods; clockwise from top left: SRTM, SRTM2, SRTM2 using a BI infusion, and rFRTM2.

