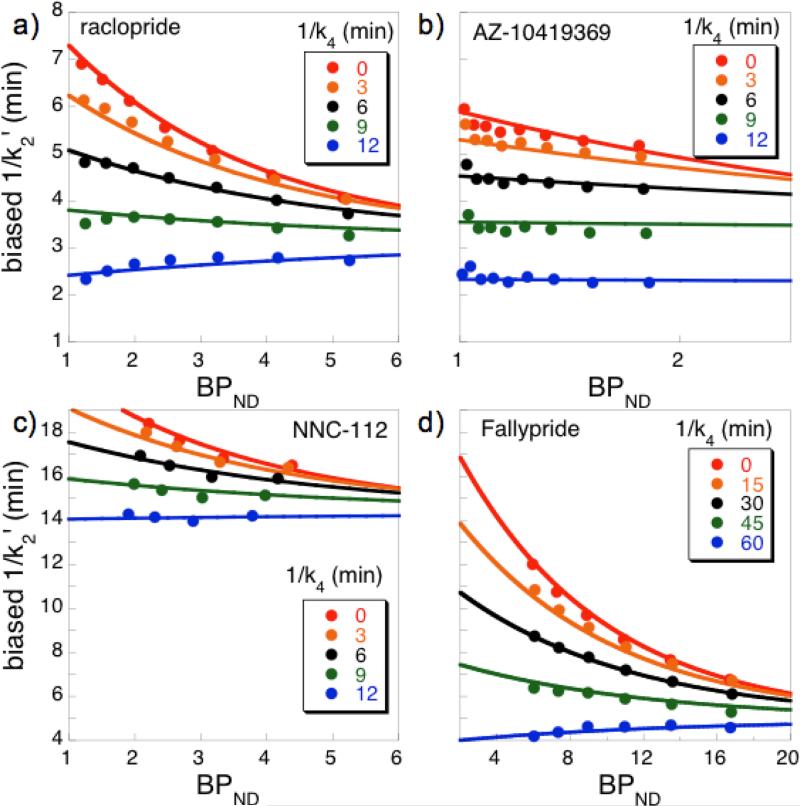
Fig. 5.
Data obtained in isoflurane-anesthetized NHP using different PET radioligands. Fitting the BPND functionality of the reference region washout time constant (1/k2′) for different values of the dissociation time constant (1/k4) facilitated model identification using Eq. 3. Red data points correspond to SRTM analysis (1/k4=0), and other sets of data points used analysis values of 1/k4 that were progressively stepped by either 3 min (a-c) or 15 min (d).

