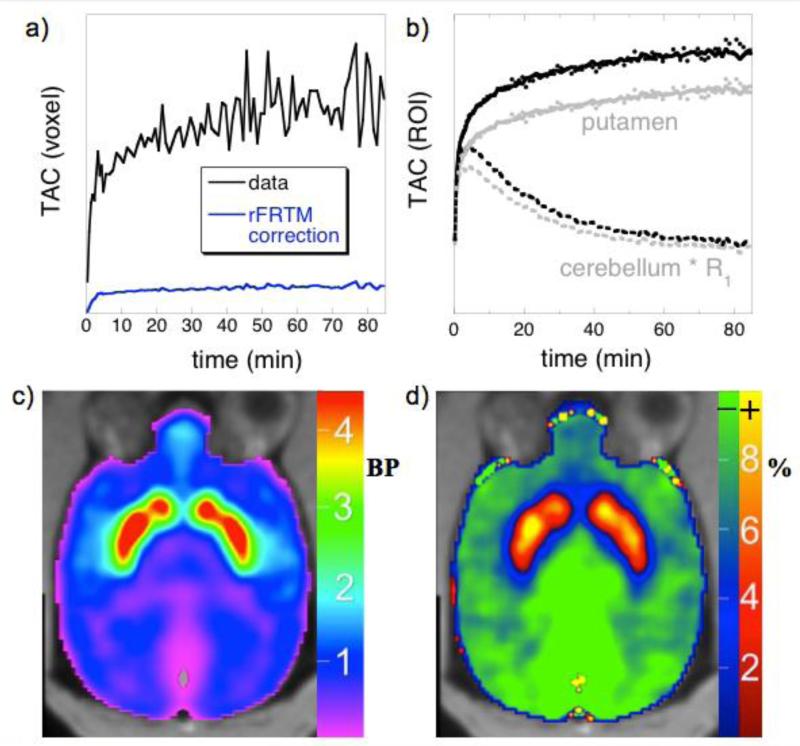
Fig. 6.
a) A time-activity curve for [11C]NNC-112 from a single voxel in putamen (black) and the rFRTM correction term of Eq. 2 (blue). b) Whole putamen (gray dots) together with an SRTM fit (gray solid line) and the reference-region (cerebellum) scaled by R1 (gray dashes); the corresponding black points and curves are the rFRTM modified data (Eq. 2), the rFRTM fit, and the R1 contribution. c) A map of BPND produced by rFRTM2 analysis of [11C]NNC-112 in NHP. d) The percent difference of BPND values produced by SRTM2 relative to rFRTM2, with blue-green colors indicting smaller SRTM2 values and red-yellow colors indicating larger SRTM2 values.

