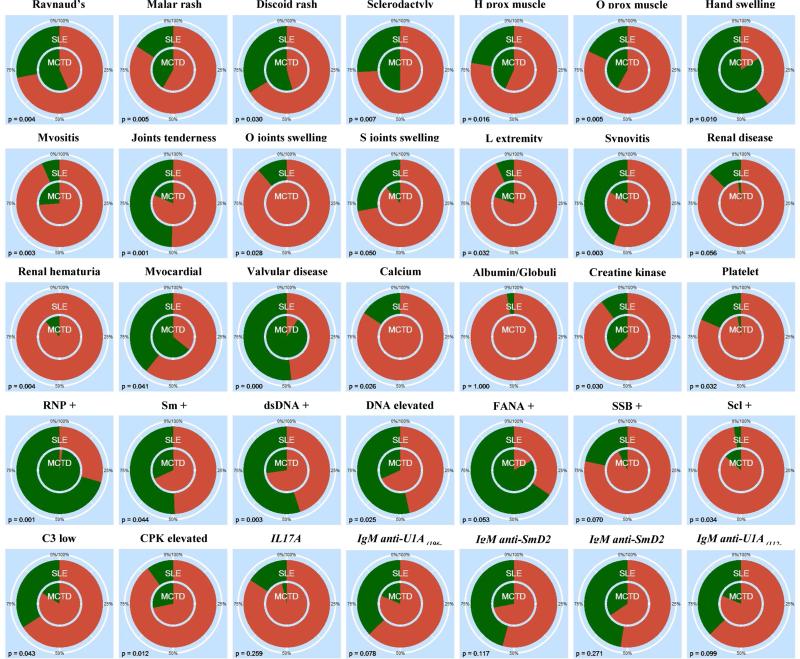
Figure 2. SLE and MCTD populations show contrasting prevalence of clinical characteristics and molecular factors.
In each graph, the inner circle represents the MCTD cohort while the outside circle is SLE population. Positive and negative values for each of the variables are represented by green and red, respectively. History of proximal muscle weakness, observed proximal muscle weakness, observed joints swelling, symmetric joints swelling, lower extremity swelling are denoted by “H prox muscle weakness”, “O prox muscle weakness”, “O joints swelling”, “S joints swelling” and “L extremity swelling”, respectively. Positive laboratory tests for ribonucleoprotein (RNP), Smith proteins (Sm), double stranded DNA (dsDNA), Fluorescent Antinuclear Antibodies (FANA), anti-La antibodies (SSB) and topoisomerase (Scl) are indicated with “+”. Experimental assays as opposed to traditional laboratory tests are in italics.

