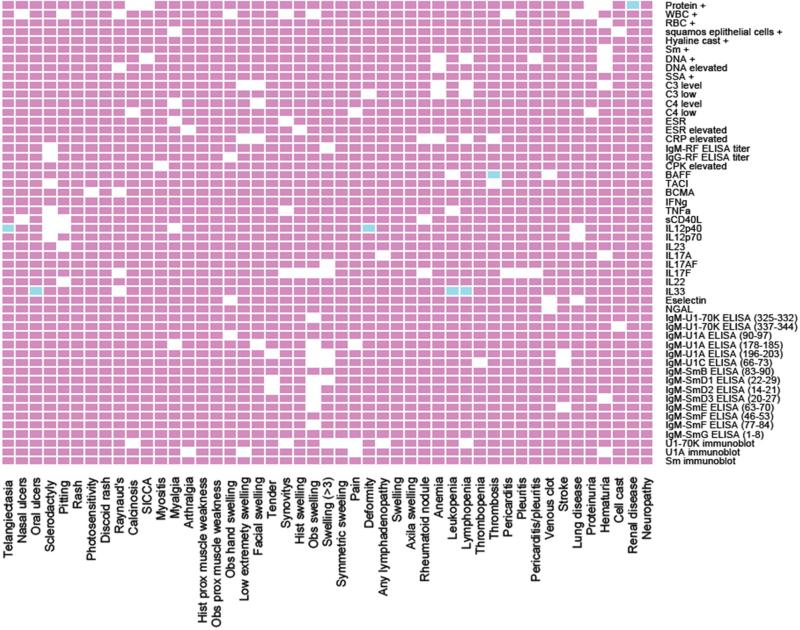
Figure 3. Proposed biomarker panel for clinical manifestations observed in SLE patients.
In the plot, the clinical symptoms and laboratory tests are represented on the “x” and “y” axis, respectively. The white, blue and red boxes indicate significant correlations, significant correlations after Bonferroni corrections, and no correlations, respectively (p ≤ 0.05). Hand swelling, proximal scleroderma, any clot, valvular heart diseases, pulmonary hypertension, pulmonary fibrosis, gastric reflux, lymph nodes swelling, morning stiffness, myocardial infarction and interleukin receptor BAFFR were initially considered in the analysis but not included due to the reduced sample size for each of these variables.

