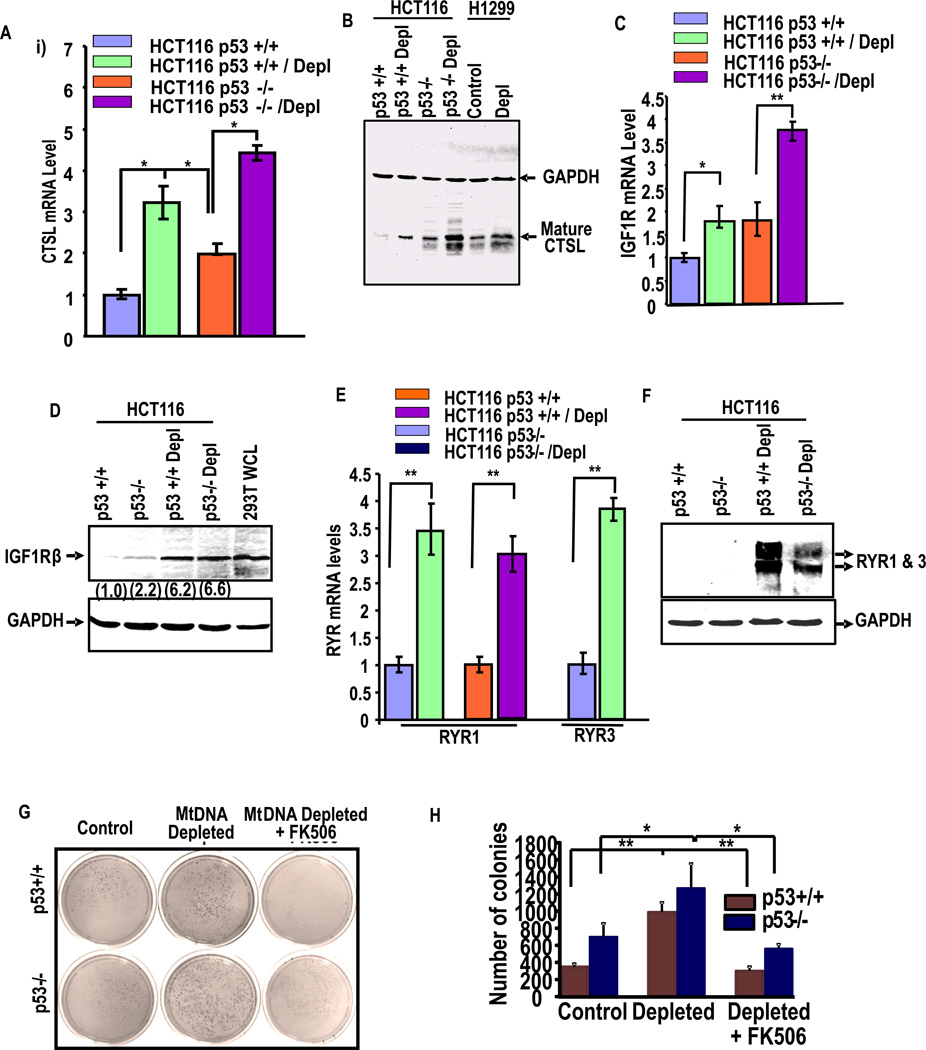
Figure 3. Activation of Retrograde signaling markers in p53+/+ and p53−/− cells.
(A) Shows the induction of cathepsin L (CTSL) mRNA, (B) CTSL protein; (C) shows the increase of IGFR1 mRNA and (D) IGF1R protein. (E) Shows the mRNA levels of Ryanodine receptor 1 and 3 in indicated cell lines and (F) shows protein levels. Values in parentheses indicate relative band intensities normalized with relative GAPDH levels. (G) Anchorage-independent growth of control and mtDNA depleted p53+/+ and p53−/− cells were analyzed by soft agar colony formation assay as described in Materials and methods. Both sets of mtDNA depleted cells were treated with or without FK506, an inhibitor calcineurin after 3 weeks of growth are shown. (H) The histograms show the average number of colonies of three different plates. Means ± S.E. were calculated from 3 independent assays. ** indicates p<0.005 and *, p< 0.05

