Figure 6.
PsbP and PsbQ in PSII.
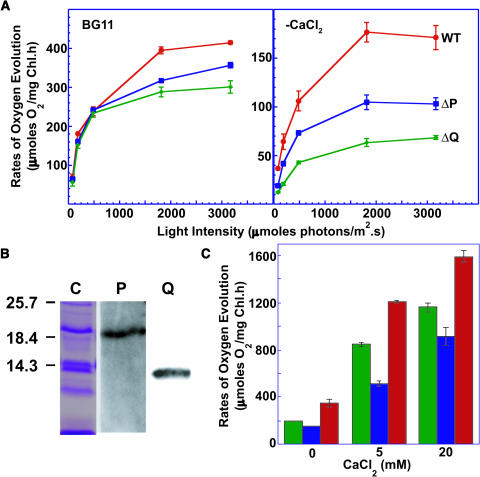
(A) Dependence of PSII-mediated oxygen evolution activities of wild-type (red circles), ΔpsbP (blue squares), and ΔpsbQ (green diamonds) cells on light intensity. Measurements were in BG11 at 30°C after growth in BG11 (left panel) or in BG11 without CaCl2 (right panel). Error bars represent standard deviation among three replicates.
(B) Immunoblot analysis of purified PSII preparations from the HT3 strain of Synechocystis 6803. Protein samples were fractionated on denaturing SDS-PAGE, transferred to nitrocellulose filter, and immunostained using antibodies against PsbP (P) and PsbQ (Q). Five micrograms of chlorophyll-containing sample was loaded in each lane. Lane C shows the Coomassie-stained profile of the fractionated proteins. Positions of molecular mass markers (kD) are shown on the left.
(C) Rates of oxygen evolution from purified PSII preparations from HT3 (red bar), HT3/ΔpsbP (blue bar), and HT3/ΔpsbQ (green bar) mutant cells in the presence of different concentrations of CaCl2. Error bars represent standard deviations among three replicates.

