Figure 2.

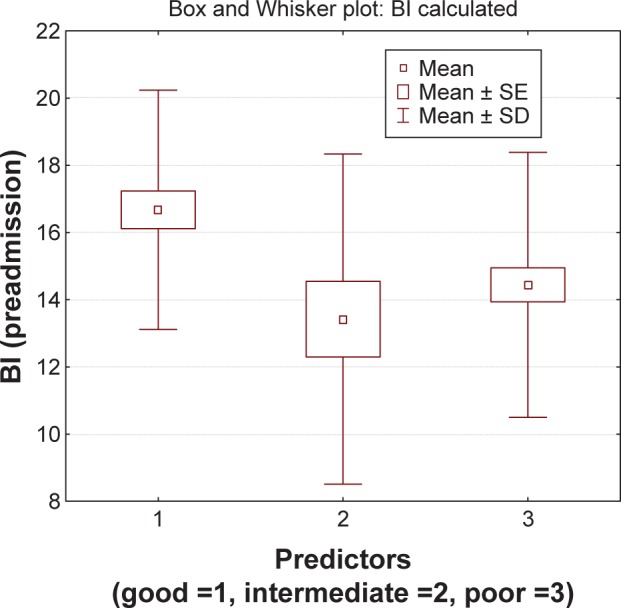
Box and Whisker plot between good (1), intermediate (2), and poor (3) outcome predictors and preadmission BI.
Abbreviations: BI, Barthel index; SE, standard error; SD, standard deviation.

Box and Whisker plot between good (1), intermediate (2), and poor (3) outcome predictors and preadmission BI.
Abbreviations: BI, Barthel index; SE, standard error; SD, standard deviation.