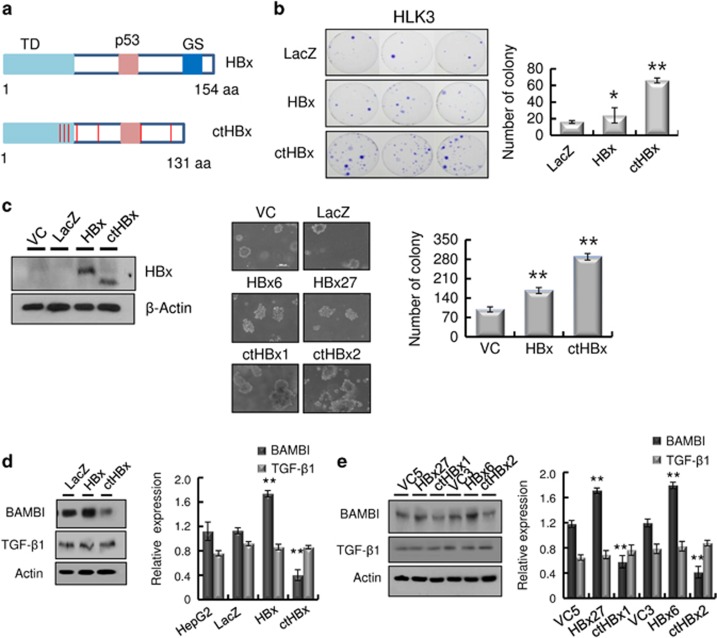
Figure 1.
Regulation of BAMBI by ctHBx in HCC. (a) Putative amino-acid sequences of ctHBx. Point mutations and C-terminal deletion mutation of HBx (ctHBx) compared with those of wild-type HBx. TD, transforming domain (aa 1–50); p53, p53-mediated repression domain (aa 88−97); GS, growth-suppressive effect domain (aa 142–154). Red vertical lines represent mutations (lower panel). (b) Clonogenicities in the HLK3 cells after transfection with an expression vector for HBx or ctHBx, assessed according to the plating efficiency in a colony-forming assay. The number of colonies was visualized by crystal violet staining of the cell cultures after 14 days of G418 selection (left). Quantification of the number of colonies (right). Values represent the mean±s.d. from three independent experiments. *P<0.05; **P<0.01. (c) Different molecular sizes of HBx and ctHBx proteins in cell lysates of HLK3 cells transiently transfected with expression plasmids (left). HBx- or ctHBx-expressing cells were grown as colonies in soft agar, and the results were compared with those from the vector control (middle). The colonies shown are 15 days old. Quantification was performed in triplicate (right). The values represent the mean±s.d. from three independent experiments. **P<0.01. (d) Immunoblot analysis of BAMBI and TGF-β1 protein expression in the transient transfectants expressing HBx or ctHBx in HLK3 cells (left). Quantification of the relative protein expression (right). Values represent the mean±s.d. from three independent experiments. **P<0.01. (e) Immunoblot analysis of BAMBI and TGF-β1 protein expression in stable HepG2 transfectants expressing HBx or ctHBx (left). Quantification of the relative protein expression (right). Values represent the mean±s.d. from three independent experiments. **P<0.01.

