Figure 1.
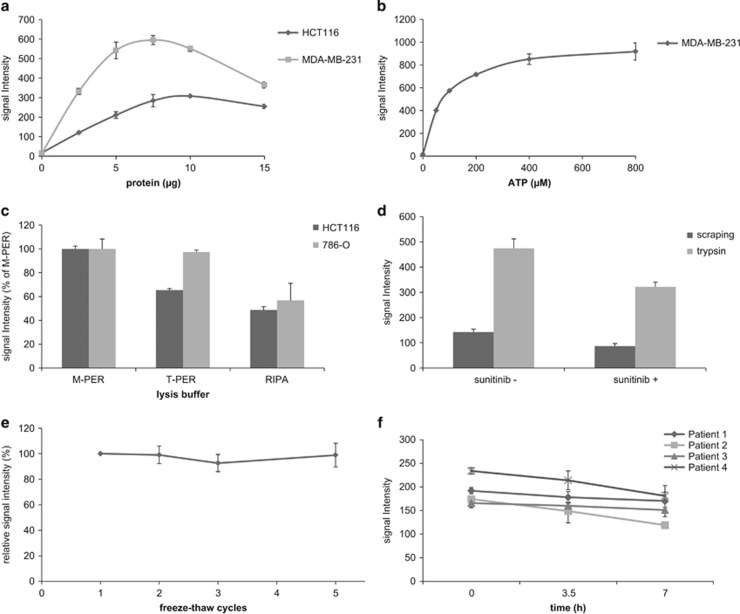
Conditions influencing optimal basal profile signal intensity. Average signal intensity ±s.d. of the 143 peptide spots is represented unless stated otherwise. (a) Basal profile signal intensities obtained with increasing lysate protein input. Optimal signal intensity was obtained using 7.5 and 10 μg of lysate protein input per array for HCT116 and MDA-MB-231, respectively. (b) Basal profile signal intensities obtained with different ATP concentrations. ATP concentrations up to 400 μM strongly increased signal intensity, while at higher concentrations the curve deviated from linearity. (c) Comparison of signal intensities with different lysis buffers. Compared to T-PER and RIPA lysis buffers, M-PER resulted in more efficient and consistent lysis of HCT116 (P<0.001 compared to both buffers, Student's t-test) and 786-O cells (P<0.001 relative to RIPA; T-PER P=0.807). Average signal intensity relative to M-PER is shown. (d) Comparison of trypsin-based cell lysis and scraping-based lysis. Trypsin-based lysis of 786-O cells enhanced signal intensity when compared to the standard scraping procedure. Incubation with 2 μM sunitinib prior to trypsin-based lysis and ex-vivo spiking of the same concentration in a scraping-based lysate resulted in an approximately 25% decrease of average signal intensity compared to the control sample (P<0.001 in both comparisons). (e) Freeze-thaw cycles. Relative to the first freeze-thaw cycle after lysate storage, average signal intensity of HCT116 lysate was not affected by additional cycles (P=0.98, ANOVA). (f) Sample conservation on ice. Conservation of sample constituents of four patient-derived tumor lysates on ice for three consecutive measurements resulted in a non-significant decline of average sample signal intensity (P=0.25, ANOVA).

