Figure 3.
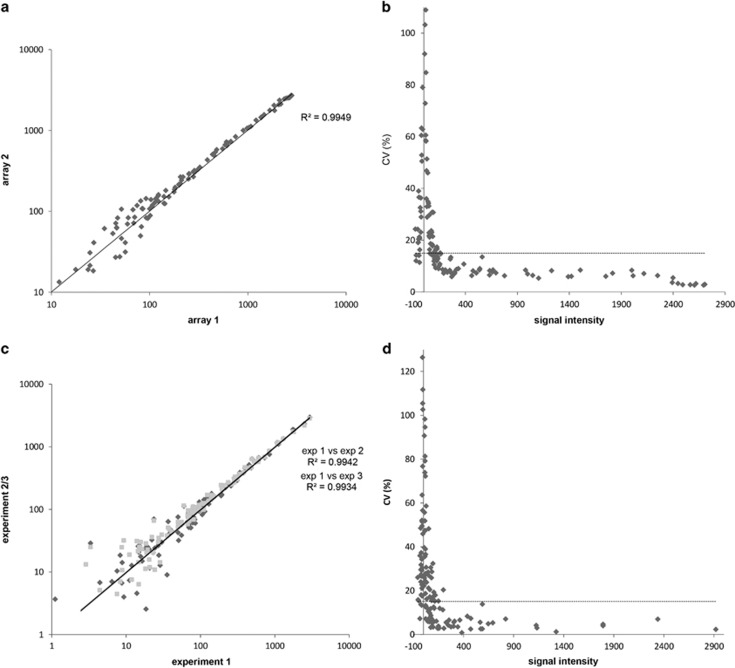
Microarray reproducibility and linearity. Inter- and intra-chip correlations between peptide phosphorylation levels as assessed by Pearson's correlations (r) using 12 technical replicates of HCT116 lysate (7.5 μg) measured on 3 chips in a single run. (a) Linearity plot of two representative technical replicates. (b) CV plot of the technical replicas shown in (a). The threshold was set at 15% as recommended by the microarray manufacturer. (c) Linearity plot of biological replicates of 786-O cells in three independent experiments. (d) CV plot of the biological replicas shown in (c). Threshold at CV 15%. CV, coefficient of variation as determined by the ratio of the standard deviation to the mean signal intensity.

