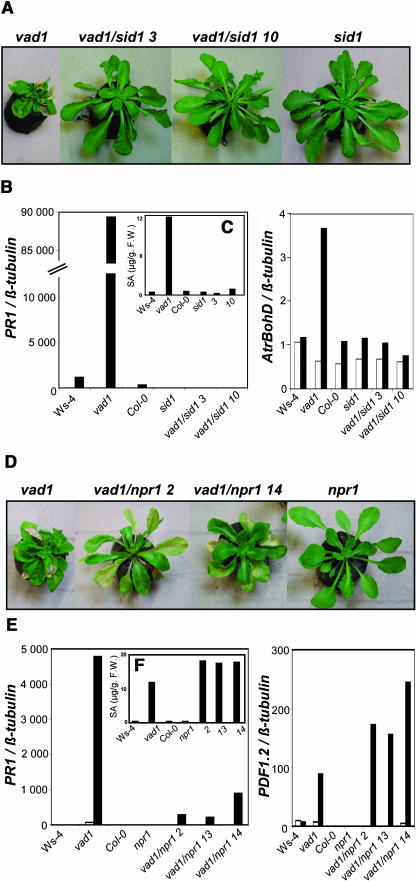
Figure 5.
Lesion Phenotypes and Defense Gene Expression in Wild-Type, Single Mutant (sid1, npr1, and vad1), and Double Mutant vad1 sid1 and vad1 npr1 Plants.
Two lines, vad1 sid1 3 and vad1 sid1 10, out of nine lines, and vad1/npr1 1 and vad1/npr1 14, out of 16 lines, are presented as examples.
(A) and (D) Five-week-old single or double vad1 sid1 (A) and vad1 npr1 (D) mutant plants 10 d after lesion formation in vad1.
(C) and (F) Total SA levels in wild-type, single, or double mutant plants vad1 sid1 (C) and vad1 npr1 (F) after lesion formation in vad1. The plant material used in (B) or (E) was also used for SA measurements.
(B) and (E) Defense gene expression in wild-type, single, or double vad1 sid1 (B) and vad1 npr1 (E) mutant plants. Transcript levels of PR-1 and AtbohD were determined by quantitative PCR in plants grown under lesion-promoting conditions 9 d before (white bars) and 6 d (black bars) after lesion formation in vad1 (B). In (E), transcript levels of PR-1 and PDF1-2 were also determined by quantitative PCR in plants grown under lesion-promoting conditions 7 d before (white bars) and 5 d (black bars) after lesion formation in vad1. See Methods for further details. F.W., fresh weight.

