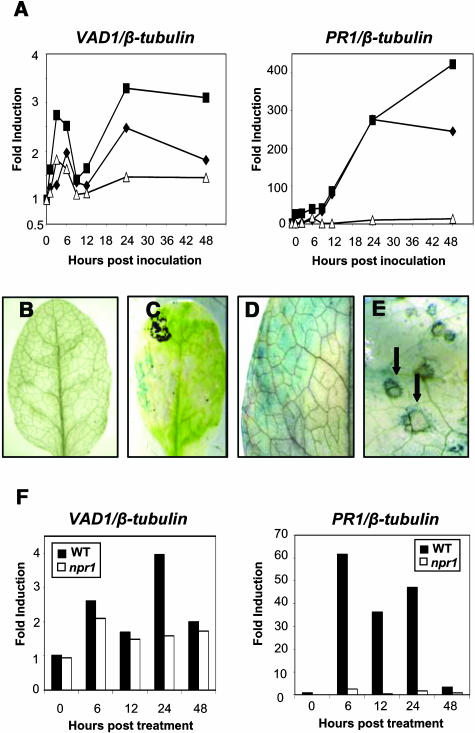
Figure 9.
VAD1 Gene Expression after Pathogen Inoculation and in Response to SA Treatment.
(A) VAD1 and PR1 transcript accumulation in wild-type plants (Col-0) at different times after inoculation with an avirulent (Xcc147) strain of X. campestris pv campestris (squares), an avirulent (DC3000/avrRpm1) strain of P. syringae pv tomato (diamonds), or after treatment with water (triangles). Transcript levels of VAD1 and PR-1 were determined by quantitative PCR as described in Methods. Results are expressed as fold induction compared with the noninoculated wild type.
(B) to (E) Histochemical localization of GUS activity in leaves from vad1 plants or plants containing a VAD1 promoter-GUS fusion, both healthy (B) and after inoculation with an avirulent (Xcc147) of X. campestris pv campestris ([C], [D], and [E]). Undetached leaves were infiltrated in a small region (1 cm2) with the bacterial strain at 108 cfu/mL and observed 48 h postinoculation (C) or sprayed with the bacterial suspension at 108 cfu/mL 6 h postinoculation (D) or 72 h postinoculation (E).
(F) VAD1 and PR1 transcript accumulation in wild-type (Ws-4) and npr1 mutant plants at different times after treatment with SA (1 mM). One representative experiment is shown from two independent experiments.

