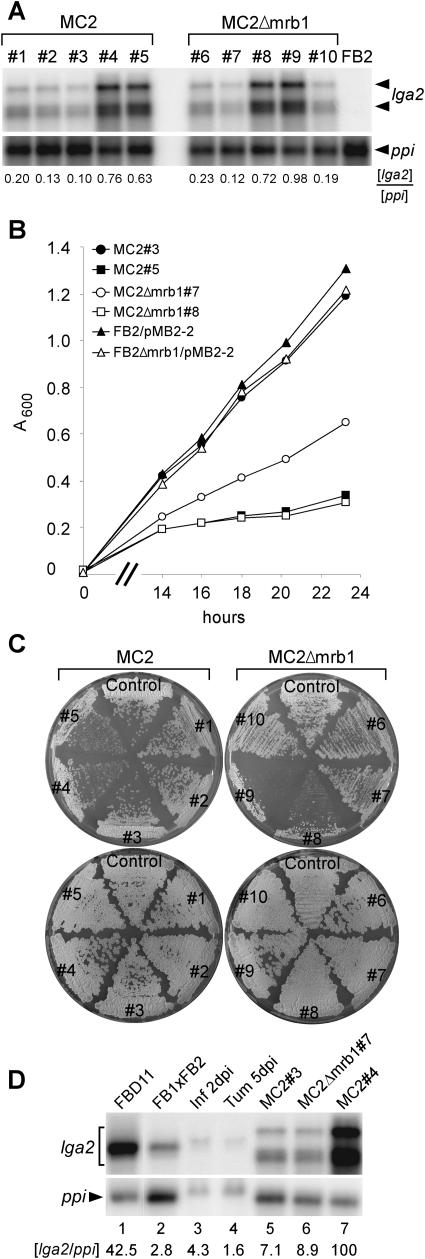
Figure 7.
Influence of lga2 Expression on Cellular Growth in the Presence or Absence of mrb1 and Comparison with lga2 Expression under Natural Conditions.
(A) Expression analysis of MC2 (a2b2) and MC2Δmrb1 strains after shifting from CM/Glu to CM/Ara medium. An RNA gel blot of total RNA (7 μg per lane) was hybridized with a 32P-labeled lga2 fragment. Radioactive signals (both for lga2) were quantified and standardized by comparison with signals obtained from the ppi gene.
(B) Growth comparison of MC2 and MC2Δmrb1 strains in liquid CM/Ara medium at 28°C. The time scale (x axis) refers to the time points after shifting from CM/Glu to CM/Ara medium. MC2#3, closed circle; MC2#5, closed square; MC2Δmrb1#7, open circle; MC2Δmrb1#8, open square; FB2/pMB2-2, closed triangle; FB2Δmrb1/pMB2-2, open triangle. Very similar results were obtained with strains MC2#2, 4 and MC2Δmrb1#6, 9 (data not shown).
(C) Individual strains were streaked out from nourseothricin containing solid PD medium on solid CM/Ara (top) or CM/Glu (bottom) medium and incubated for 64 h at 28°C. Control (left), FB2/pMB2-2; control (right), FB2Δmrb1/pMB2-2.
(D) Comparison of lga2 expression in MC2 and MC2Δmrb1 strains with expression during distinct stages of development. The strains and strain combinations indicated at the top (lanes 1 and 2) were grown on CM-charcoal plates for 48 h for RNA preparation. Lanes 3 and 4, RNA was isolated from infected (FB1xFB2) leaves and leaf tumors 2 and 5 DAI, respectively. Lanes 5 to 7, see (A); 7 μg (lanes 1 and 5 to 7), 15 μg (lane 2), and 80 μg (lanes 3 and 4) RNA were loaded. Two identical RNA gel blots were hybridized with 32P-labeled lga2 and ppi fragments, respectively. Radioactive signals were quantified and the ratios of lga2/ppi hybridization signals were calculated with the most intensive signal (lane 7) set to 100. For lanes 5 to 7, both lga2 signals were used for quantification. Different transcript sizes are probably because of variations in transcription start sites.

