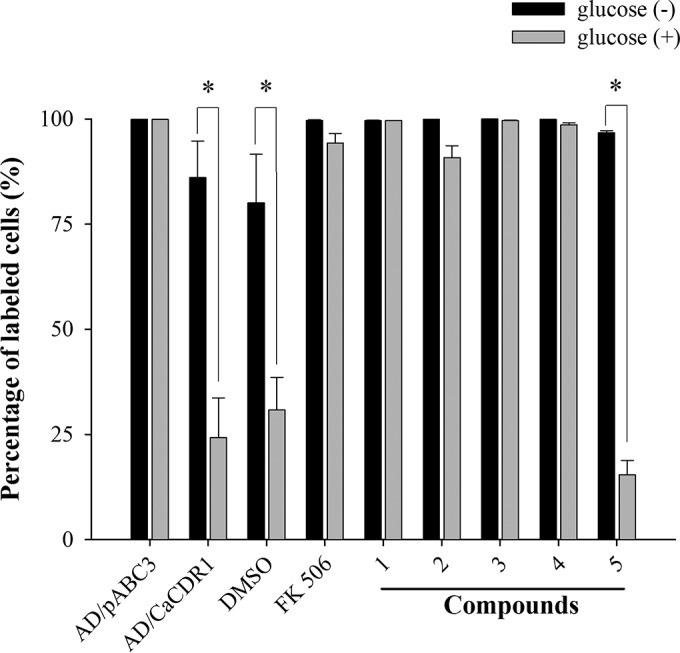
FIG 5.

Quantification by flow cytometry of the CaCdr1p pump-inhibitory effects of organotellurium compounds 1 to 5. The bars indicate the percent R6G accumulation relative to the sensitive control strain AD/pABC3, which was set to 100%, in the absence (■) or presence () of 0.2% glucose of R6G-preloaded AD/CaCDR1 cells incubated in the presence of DMSO, 10 μM FK506 (8.0 μg/ml), or 100 μM compounds 1 to 5 (34, 35, 36, 38, and 40 μg/ml, respectively). The data represent the means ± the standard errors from three independent experiments (*, P < 0.05).
