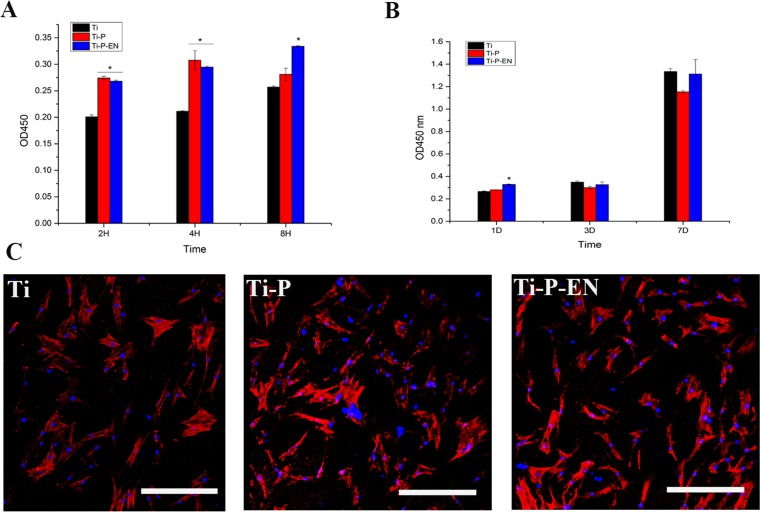
FIG 3.
(A and B) Adhesion and proliferation of hBMSCs onto the Ti samples, measured by the Cell Counting Kit-8 (CCK-8) assay at 2, 4, and 8 hours and 1, 3, and 7 days. *, P < 0.05. H, hours; D, days. (C) CLSM to characterize hBMSC morphology and spread onto the Ti surface at the same time points used for the assays whose results are presented in panels A and B. Cells plated on either control or enoxacin-modified surfaces for times out to 24 h showed no differences in morphology or number as a function of the surface modification. After 24 h of incubation, the hBMSC actin cytoskeleton was visualized by Alex Flour 446 staining (red fluorescence) and nuclei were stained with DAPI (blue fluorescence). Bar, 50 µm.

