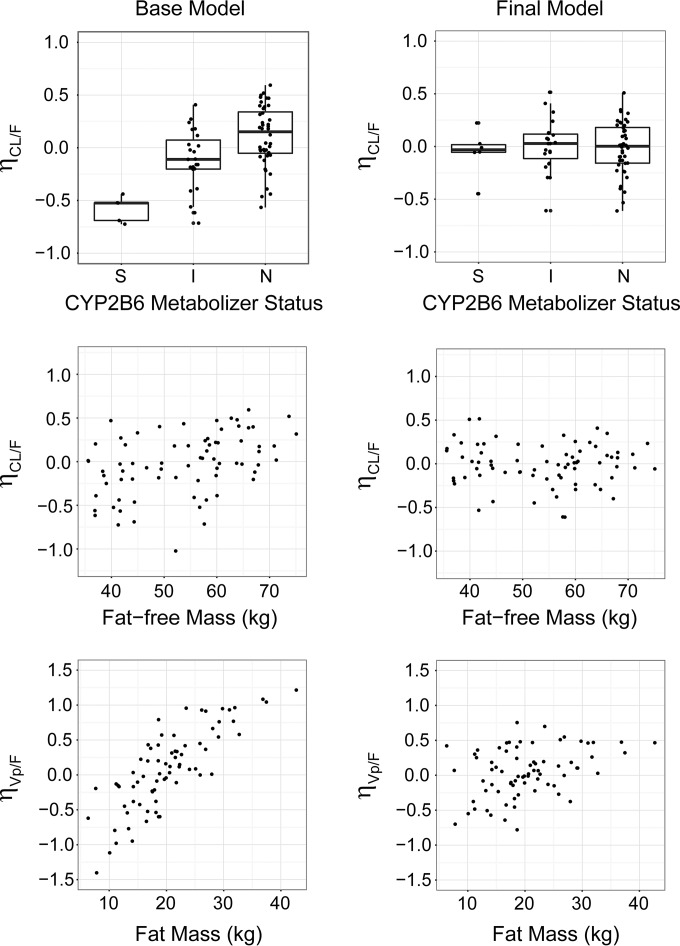
FIG 1.
Relationship between CL/F or Vp/F and influential covariates for the base and final models. Between-subject variabilities in CL/F (ηCL/F) or Vp/F (ηVp/F) versus CYP2B6 metabolizer status (top panels), fat-free mass (kg) (middle panels), and fat mass (kg) (bottom panels) are shown. These relationships are illustrated for estimates of ηCL/F and ηVp/F prior to incorporation of covariate effects in the model (base model; left column) or after adjusting for these covariates in the model (final model; right column). Boxplots shown in the top panels depict five-number summaries as horizontal lines representing (from top to bottom) 75th percentile + (1.5 × interquartile range) (end of upper whisker), 75th percentile, median, 25th percentile, and 25th percentile − (1.5 × interquartile range) (end of lower whisker).

