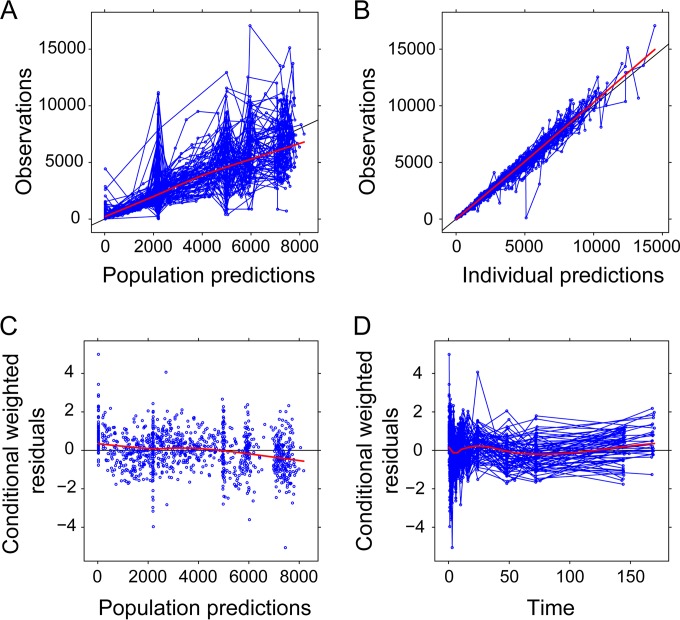
FIG 3.
Diagnostic plots for the final population-based pharmacokinetic model. (A and B) Observed plasma efavirenz concentrations (nmol/liter) versus population-predicted (A) or individual-predicted (B) efavirenz concentrations (nmol/liter). Paired observed and predicted concentration measurements for a given subject are plotted as circles and connected by lines. (C) Conditional weighted residuals versus population-predicted efavirenz concentrations (nmol/liter). (D) Conditional weighted residuals versus time (hours). Residuals for a given subject are plotted as circles and connected by lines. In panels A to D, red lines represent the result of a loess smoother with fitting by weighted least-squares.

