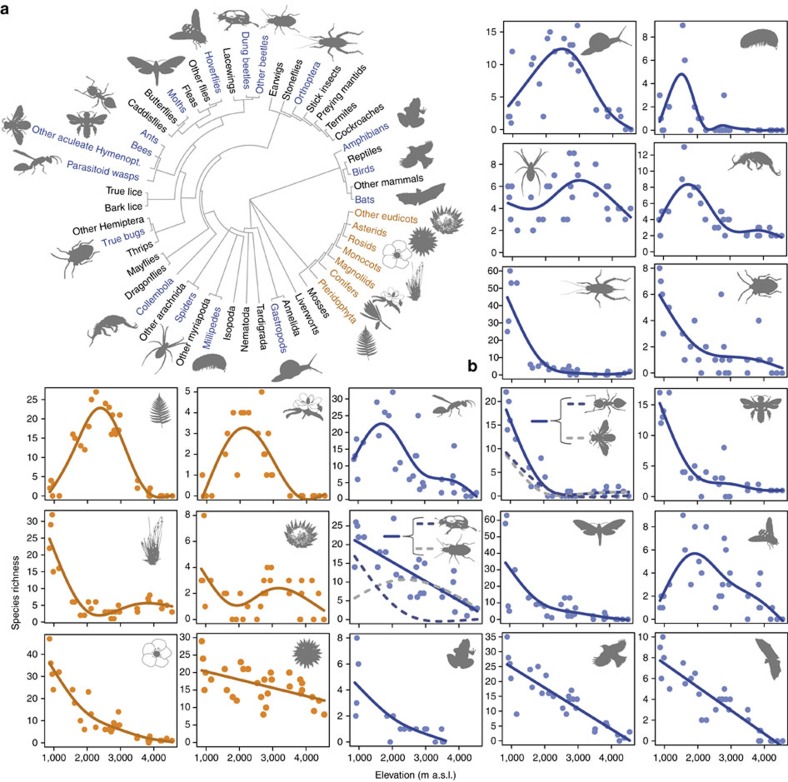
Figure 1. Patterns of elevational species richness of single taxa.
(a) Phylogenetic distribution of studied taxonomic groups among major terrestrial plant and animal lineages. (b) Patterns of elevational species richness for vascular plants (orange) and animals (blue). Dots represent original measurements on study sites (plants: N=30; animals: N=30, except for Collembola (N=29), ground-dwelling beetles (N=29) and amphibians (N=17)). Trend lines were calculated using generalized additive models; all trends were significant (P<0.05). For trend lines of additional plant groups with low numbers of species see Supplementary Fig. 3. The plant and animal images used in the figure are licensed for use in the Public Domain without copyright, except for the images used for monocots (F. & K. Starr, modified), bats (O. Peles and Y. Wong), Collembola, ground-dwelling beetles (B. Lang), Orthoptera, other aculeate wasps, bees (M. Menchetti), gastropods (G. Monger) that are licenced under a Creative Commons Attribution 3.0 Unported licence (https://creativecommons.org/licenses/by/3.0). Oliver Niehuis kindly provided the permission to use the image of the parasitoid wasp.

