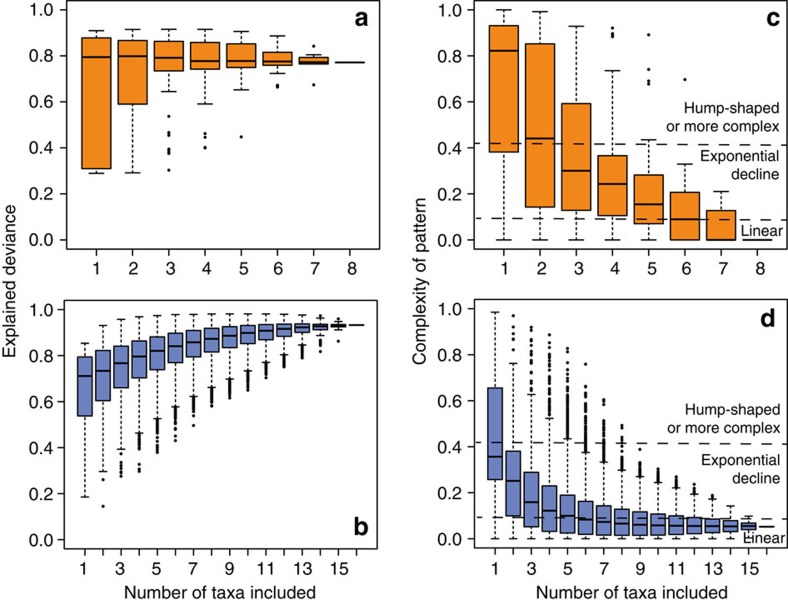
Figure 2. Elevational species richness patterns with increasing taxonomic coverage.
(a,b) The explained deviance of generalized additive models increased with increasing taxonomic coverage of plant (orange: a,c) and animal (blue: b,d) communities. (c,d) While single taxonomic groups showed a variation of elevational species richness patterns (that is, linear decline, exponential decline or hump-shaped distributions) increasing the taxonomic coverage unambiguously led to patterns of linear decline in both plants and animals. In individual box-and-whisker-plots, bold lines indicate the median, boxes the interquartile range. Whiskers extend to the maximum and minimum values but end at 1.5 × the interquartile range. More extreme data are plotted as single dots.

