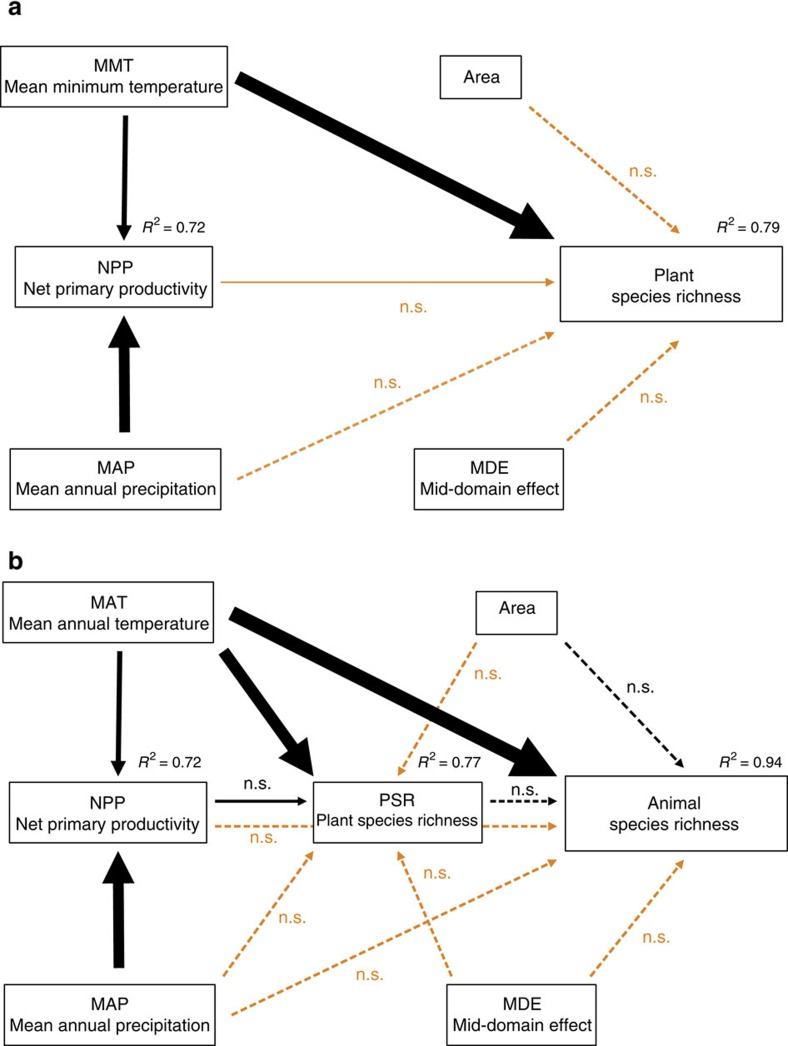
Figure 5. Path models showing direct and indirect effects of predictor variables on species richness.
For plants (a) and animals (b), the path model with the lowest Akaike information criterion (AICc) is presented as solid lines. Interrupted lines indicate potential paths used for the construction of competing models (all models with ΔAICc<3 identified by multi-model inference) but which were excluded from the final path model. For all paths of the final path model, arrow width is proportional to the relative strength of standardized path coefficients. Orange and black arrows indicate negative and positive effects, respectively. For each endogenous variable the relative amount of explained variance is given. n.s., not significant.

